Amdahl's Law - The Theoretical Relationship Between Speedup and Concurrency
April 29, 2025
This is Part 3 of our blog series on scaling Rails applications.
We have only two parameters to work with if we want to fine-tune our Puma configuration.
- The number of processes.
- The number of threads each process can have.
In part 1 of Scaling Rails series, we saw what the number of processes should be. Now let's look at what the number of threads in each process should be.
Amdahl's law
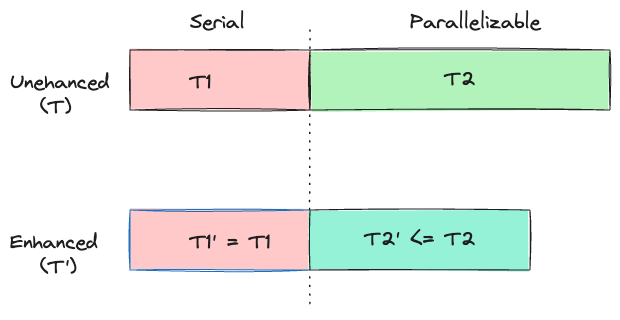
Each application has a few things which must be performed in "serial order" and a few things which can be "parallelized". If we draw a diagram, then this is what it will look like.

Let's say that T1' and T2' are the enhanced times. These are the times the
application would take after the enhancement has been applied. In this case the
enhancement will come in the form of increasing the threads in a process.
T1' will be same as T1 since it's the serial part. T2' will be lower than
T2 since we will parallelize some of the code. After the parallelization is
done, the enhanced version would look something like this.

It's clear that the serial part (T1) will limit how much speedup we can get no
matter how much we parallelize T2.
Computer scientist Gene Amdahl came up with Amdahl's law which gives the mathematical value for the overall speedup that can be achieved.

I made a video explaining how this formula came about.
Amdahl's law states that the theoretical speedup gained from parallelization is directly determined by the fraction of sequential code in the program.
Now, let's see how we can use Amdahl's law to determine the ideal number of threads.
The parallelizable portion in this case is the portion of the application that spends time doing I/O. The non-parallelizable portion is the time spent by the application executing Ruby code. Remember that because of GVL, within a process, only one thread has access to CPU at any point of time.
Now we need to know what percentage of time our app spends doing I/O. This will
be the value p as per the video.
Later in this series, we'll show you how to calculate what percentage of the
time the Rails application is spending doing I/O. For this blog let's assume
that our application spends 37% of the time doing I/O i.e the value of p is
0.37.
Let's calculate how much speedup we will get if we use one thread(n is 1). Now let's change n to 2 and get the speedup value. Similarly, we bump up n all the way to 15 and we record the speedup.
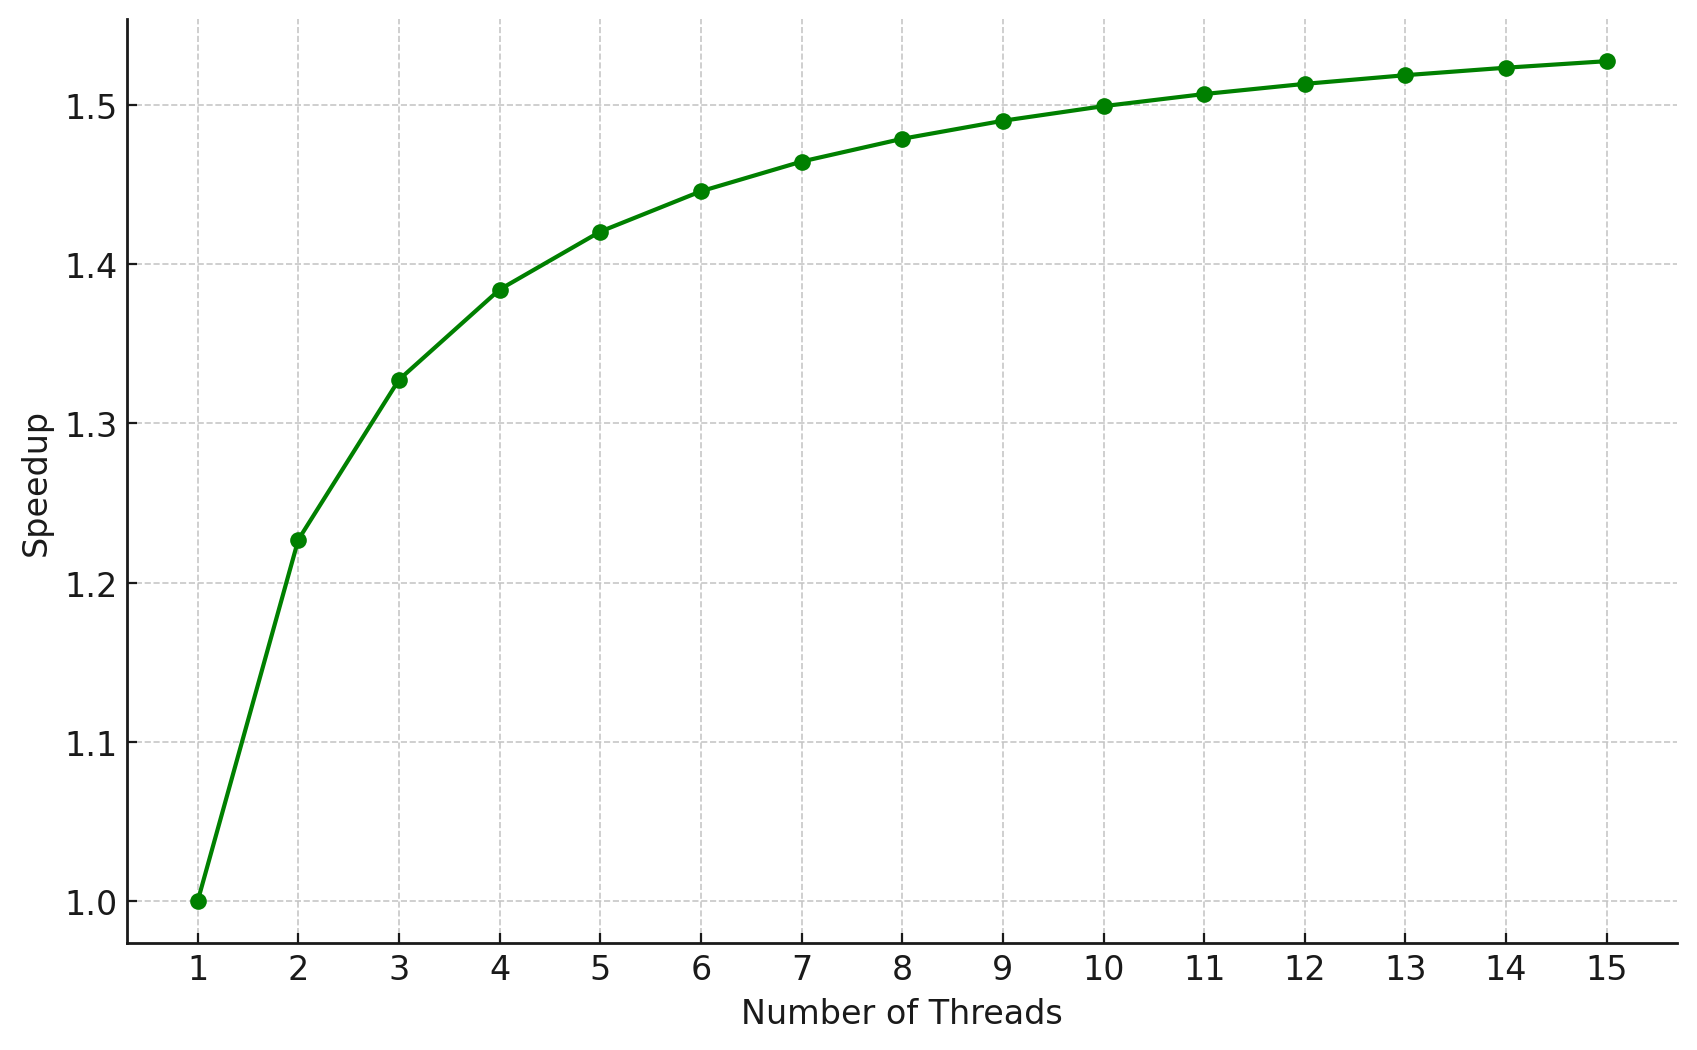
Now let's draw a graph between the overall speedup and the number of threads.

From the graph, it can be seen that the speedup increases as the number of threads increases, but the rate of increase diminishes as more threads are added. This is because the serial portion remains constant and is unaffected by the increase in threads.
| Threads(N) | Speedup(S) | % Improvement from previous run |
|---|---|---|
| 1 | 1.000 | - |
| 2 | 1.227 | 22.7% |
| 3 | 1.366 | 11.3% |
| 4 | 1.456 | 6.6% |
| 5 | 1.518 | 4.2% |
| 6 | 1.562 | 2.9% |
| 7 | 1.594 | 2.0% |
| 8 | 1.619 | 1.6% |
By examining the graph we can observe that the speedup gain from increasing threads seem significant up to 4 threads, after which the incremental gain in speedup starts to plateau.
Remember that these are theoretical maximums based on Amdahl's law. In practice, we need to use fewer threads as adding more threads can cause an increase in memory usage and GVL contention, thereby causing latency spikes.
It's obvious that if we add more threads then more requests can be handled by Puma concurrently. What it means is that requests will be waiting for lesser time at the load balancer layer as there are more Puma threads waiting to pick up the request for processing. But in part 1, we saw that just because we have more threads, it doesn't mean things will move faster. More threads might cause other threads to wait for the GVL.
There is no point in accepting requests if our web server can't respond to it
promptly. Whereas, if the max_threads value is set to a lower value, requests
will queue up at the Load Balancer layer which is better than overwhelming the
application server.
If more and more requests are waiting at the load balancer level, then the request queue time will shoot up. The right way to solve this problem is to add more Puma processes. It is advised to increase the capacity of the Puma server by adding more processes rather than increasing the number of threads.
Here is a middleware that can be used to track the request queue time. This code is taken from judoscale.
Note that Request Queue Time is the time spent waiting before the request is picked up for processing.
This middleware will only work if the load balancer is adding the
HTTP_REQUEST_START header. Heroku automatically adds this header.
Now we need to use this middleware and for that open config/application.rb
file and we need to add the following line.
config.middleware.use RequestQueueTimeMiddleware
This was Part 3 of our blog series on scaling Rails applications. If any part of the blog is not clear to you then please write to us at LinkedIn, Twitter or BigBinary website.
Follow @bigbinary on X. Check out our full blog archive.