Grafana Loki and Kubernetes Event exporter

May 7, 2024
In the previous blog, we discussed integrating Prometheus and Grafana in the Kubernetes Cluster. In this blog, we'll explore how to integrate the Kubernetes Event exporter & Grafana Loki into your Kubernetes Cluster using a helm chart.
Additionally, you’ll also learn how to add Grafana Loki as a data source to your Grafana Dashboard. This will help you visualize the Kubernetes events.
Furthermore, we'll delve into the specifics of setting up the Event exporter and Grafana Loki, ensuring you understand each step of the process. From downloading and configuring the necessary helm charts to understanding the Grafana Loki dashboard, we'll cover it all.
By the end of this blog, you'll be able to fully utilize Grafana Loki and Kubernetes Event Exporter, gaining insights from your Kubernetes events.
How Kubernetes event exporter can help us in monitoring health
Objects in Kubernetes, such as Pod, Deployment, Ingress, Service publish events to indicate status updates or problems. Most of the time, these events are overlooked and their 1-hour lifespan might cause missing important updates. They are also not searchable and cannot be aggregated.
For instance, they can alert you to changes in the state of pods, errors in scheduling, and resource constraints. Therefore, exporting these events and visualizing them can be crucial for maintaining the health of your cluster.
Kubernetes event exporter allows exporting the often missed Kubernetes events to various outputs so that they can be used for observability or alerting purposes. We can have multiple receivers to export the events from the Kubernetes cluster.
- Opsgenie
- Webhooks/HTTP
- Elasticsearch
- OpenSearch
- Slack
- Kinesis
- Firehose
- SNS
- SQS
- File
- Stdout
- Kafka
- OpsCenter
- Customize Payload
- Pubsub
- Teams
- Syslog
- Bigquery
- Pipe
- Event Bridge
- Grafana Loki
Setting up Grafana Loki & Kubernetes event exporter using Helm chart
We will once again use ArtifactHub, which provides a helm chart for installing Grafana Loki onto a Kubernetes Cluster. If you need instructions on how to install Helm on your system, you can refer to this blog.
In this blog post, we will install a Helm chart that sets up Loki in scalable mode, with separate read-and-write components that can be independently scaled. Alternatively, we can install Loki in monolithic mode, where the Helm Chart installation runs the Grafana Loki single binary within a Kubernetes cluster. You can learn more about this here.
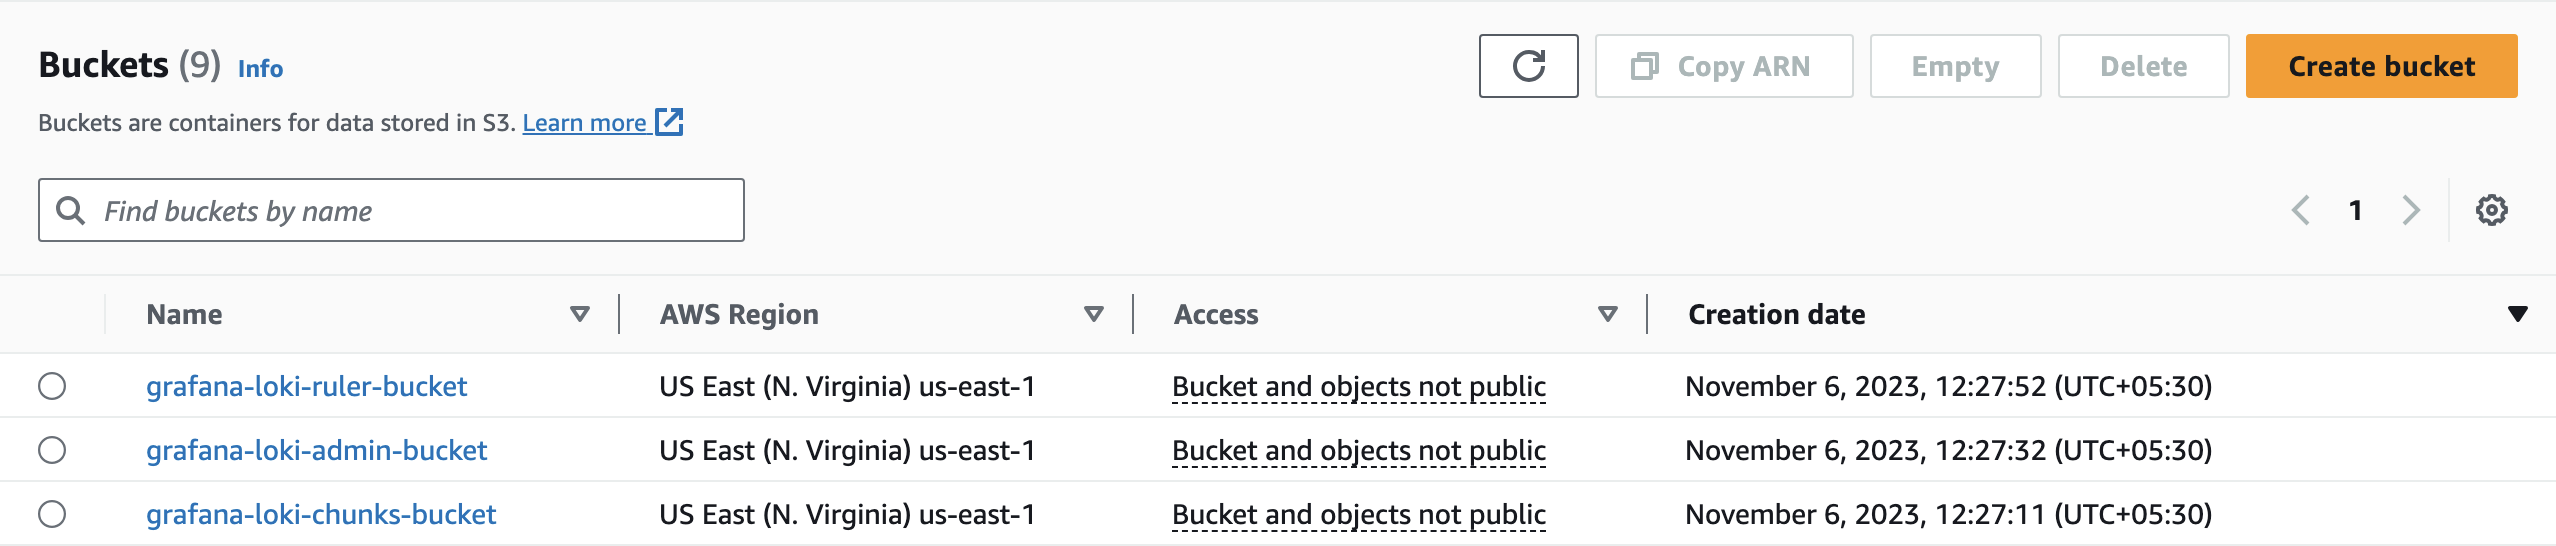
1. Create S3 buckets
-
grafana-loki-chunks-bucket
-
grafana-loki-admin-bucket
-
grafana-loki-ruler-bucket
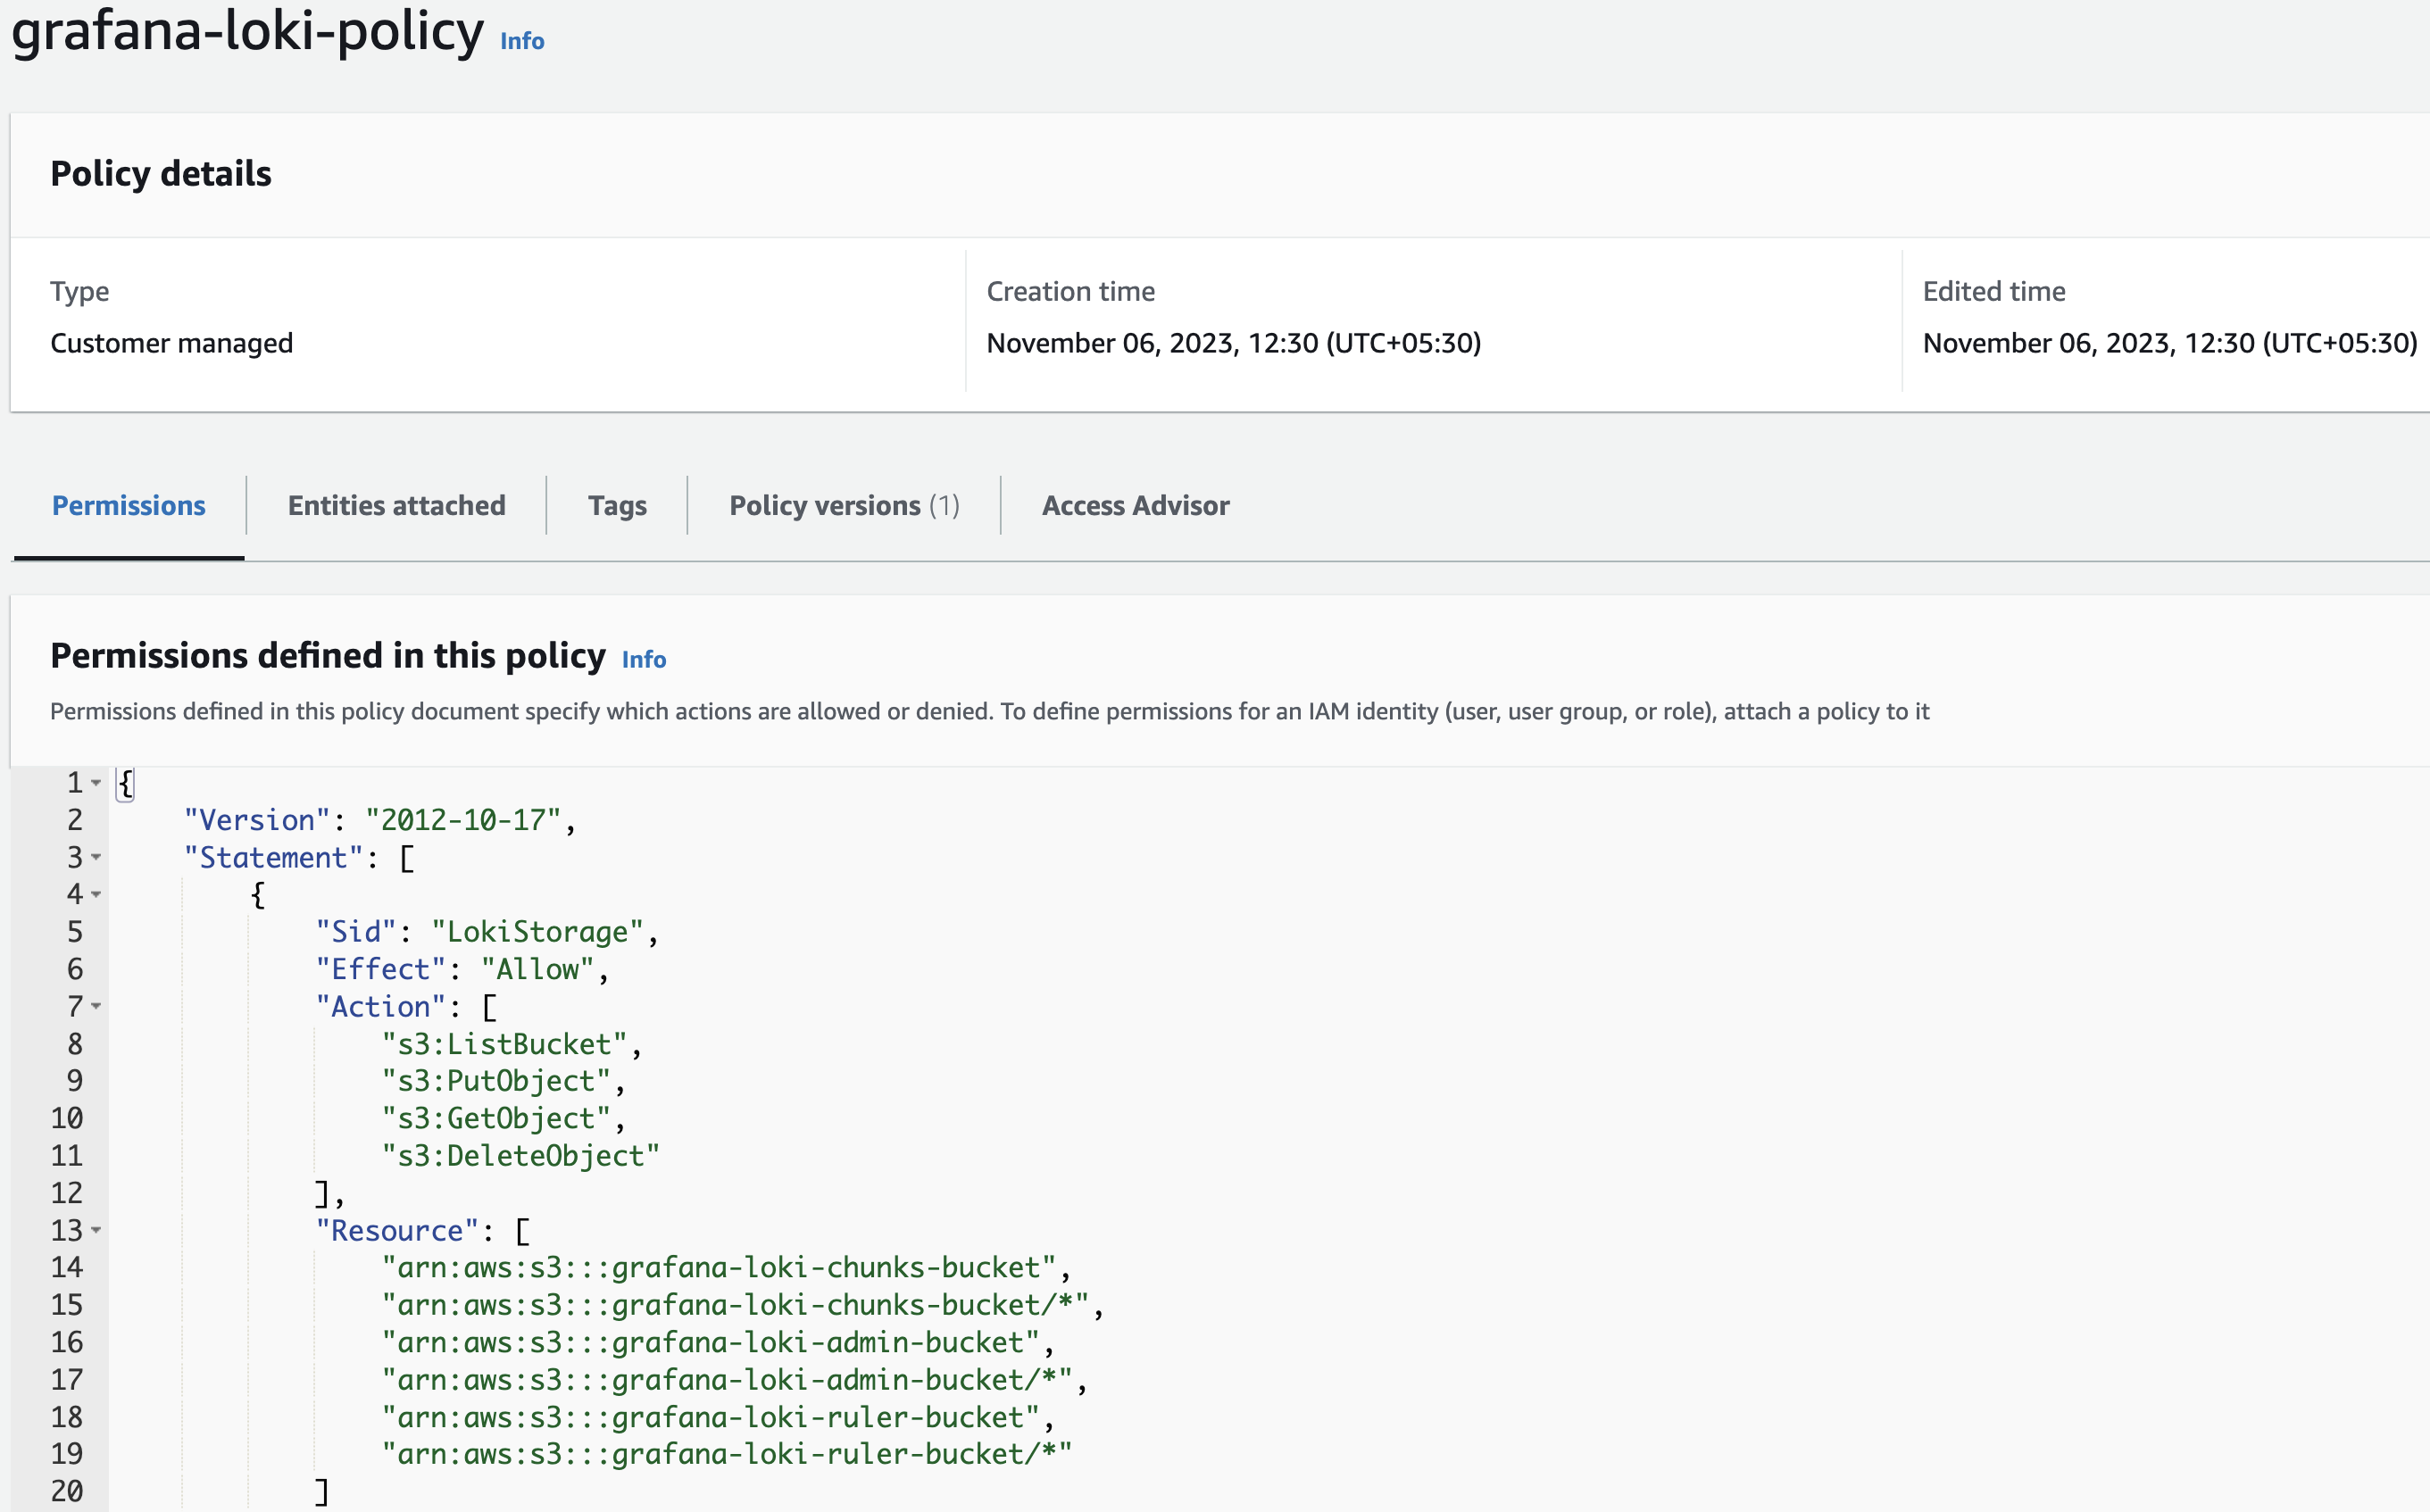
2. Create a policy for Grafana Loki
Create a new policy under IAM on Amazon AWS using the below snippet.
{
    "Version": "2012-10-17",
    "Statement": [
        {
            "Sid": "LokiStorage",
            "Effect": "Allow",
            "Action": [
                "s3:ListBucket",
                "s3:PutObject",
                "s3:GetObject",
                "s3:DeleteObject"
            ],
            "Resource": [
                "arn:aws:s3:::grafana-loki-chunks-bucket",
                "arn:aws:s3:::grafana-loki-chunks-bucket/*",
                "arn:aws:s3:::grafana-loki-admin-bucket",
                "arn:aws:s3:::grafana-loki-admin-bucket/*",
                "arn:aws:s3:::grafana-loki-ruler-bucket",
                "arn:aws:s3:::grafana-loki-ruler-bucket/*"
            ]
        }
    ]
}
Output:
3. Create a Role with the above permission
Create a role with a custom trust policy & use the below snippet
{
    "Version": "2012-10-17",
    "Statement": [
        {
            "Effect": "Allow",
            "Principal": {
                "Federated": "arn:aws:iam::account_id:oidc-provider/oidc.eks.us-east-1.amazonaws.com/id/open_id"
            },
            "Action": "sts:AssumeRoleWithWebIdentity",
            "Condition": {
                "StringEquals": {
                    "oidc.eks.us-east-1.amazonaws.com/id/open_id:aud": "sts.amazonaws.com",
                    "oidc.eks.us-east-1.amazonaws.com/id/open_id:sub": "system:serviceaccount:default:grafana-loki-access-s3-role-sa"
                }
            }
        }
    ]
}
Note: Please update the account_id and open_id in the above given snippet.
grafana-loki-access-s3-role-sa is the service account name that we will mention in the Loki values.
4. Add Grafana using the helm chart
To get this Helm chart, run this command:
helm repo add grafana https://grafana.github.io/helm-charts
helm repo update
Output:
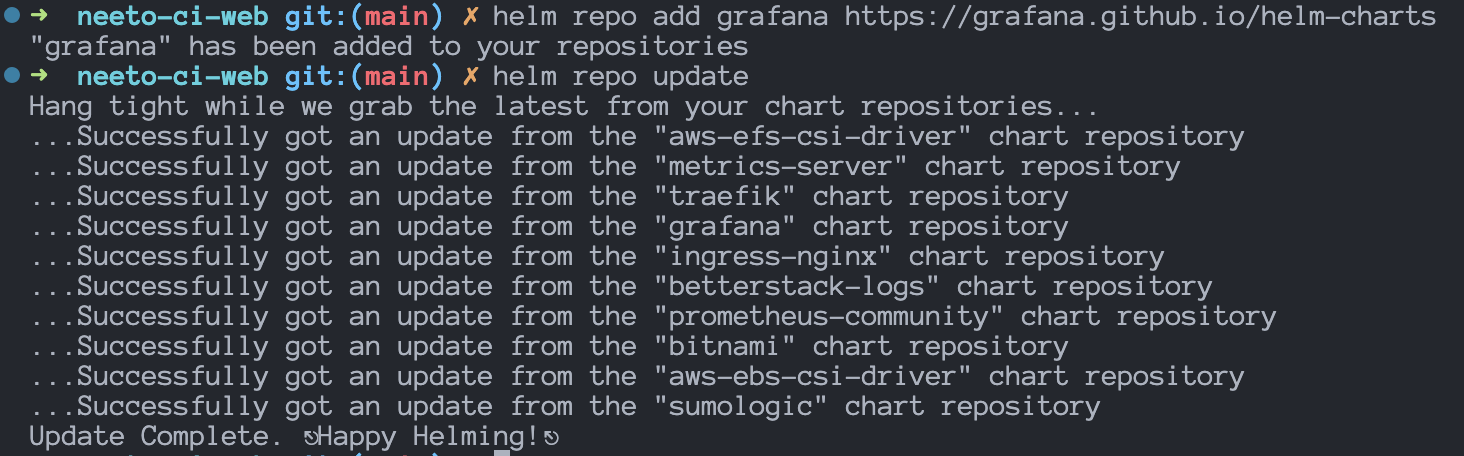
We have downloaded the latest version of the Grafana.
5. Install grafana/loki stack using the helm chart
Create a loki-values yaml file with the below snippet
loki:
  readinessProbe: {}
  auth_enabled: false
  storage:
    bucketNames:
      chunks: grafana-loki-chunks-bucket
      ruler: grafana-loki-rules-bucket
      admin: grafana-loki-admin-bucket
    type: s3
    s3:
      endpoint: null
      region: us-east-1
      secretAccessKey: null
      accessKeyId: null
      s3ForcePathStyle: false
      insecure: false
monitoring:
  lokiCanary:
      enabled: false
  selfMonitoring:
    enabled: false
test:
  enabled: false
serviceAccount:
  create: true
  name: grafana-loki-access-s3-role-sa
  imagePullSecrets: []
  annotations:
    eks.amazonaws.com/role-arn: arn:aws:iam::account_id:role/loki-role
  automountServiceAccountToken: true
To install Loki using the Helm Chart on Kubernetes Cluster, run
this helm install command:
helm install my-loki grafana/loki --values loki-values.yaml
Output:
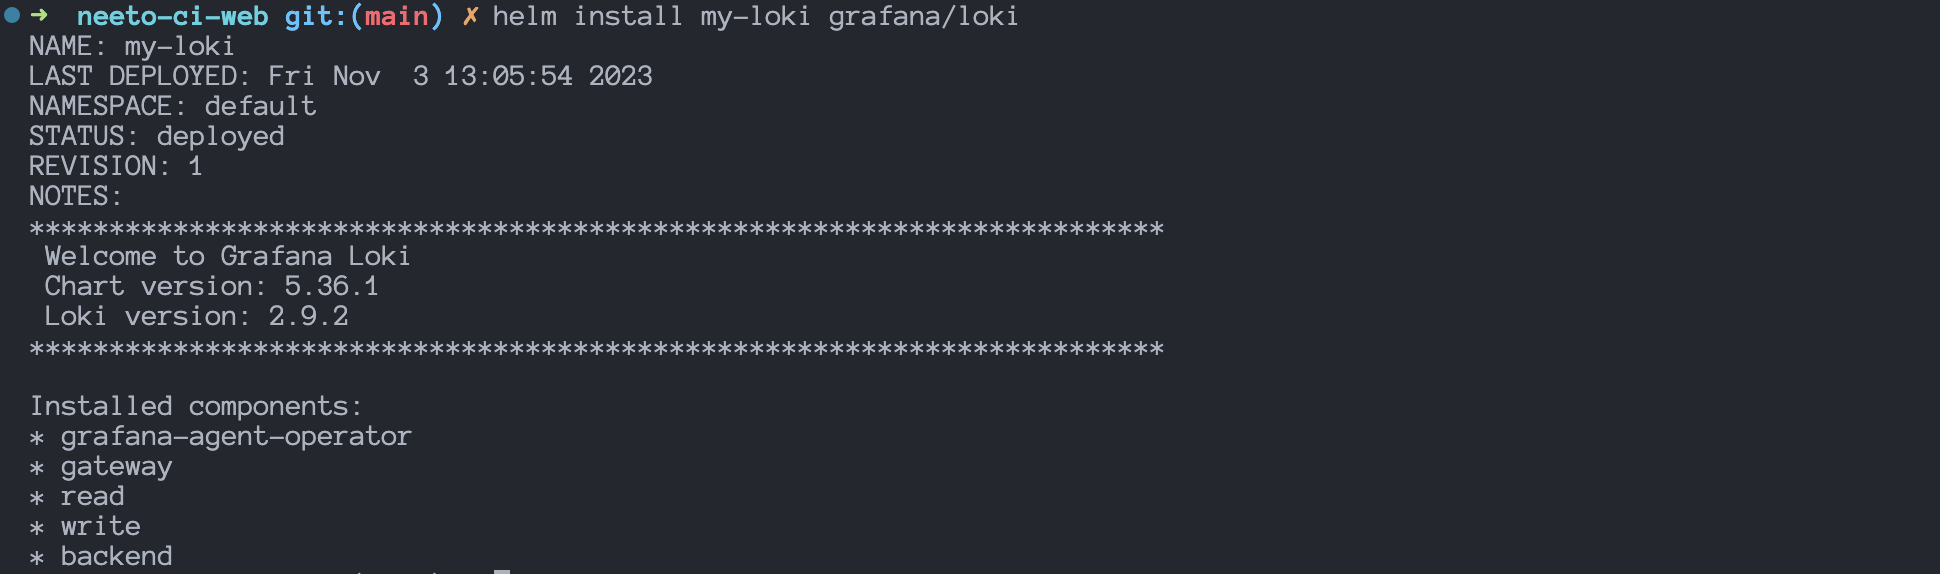
We have successfully installed Loki on the Kubernetes Cluster.
Run the following command to view all the resources created by the Loki Helm Chart in your Kubernetes cluster:
kubectl get all -l app.kubernetes.io/name=loki
Output:
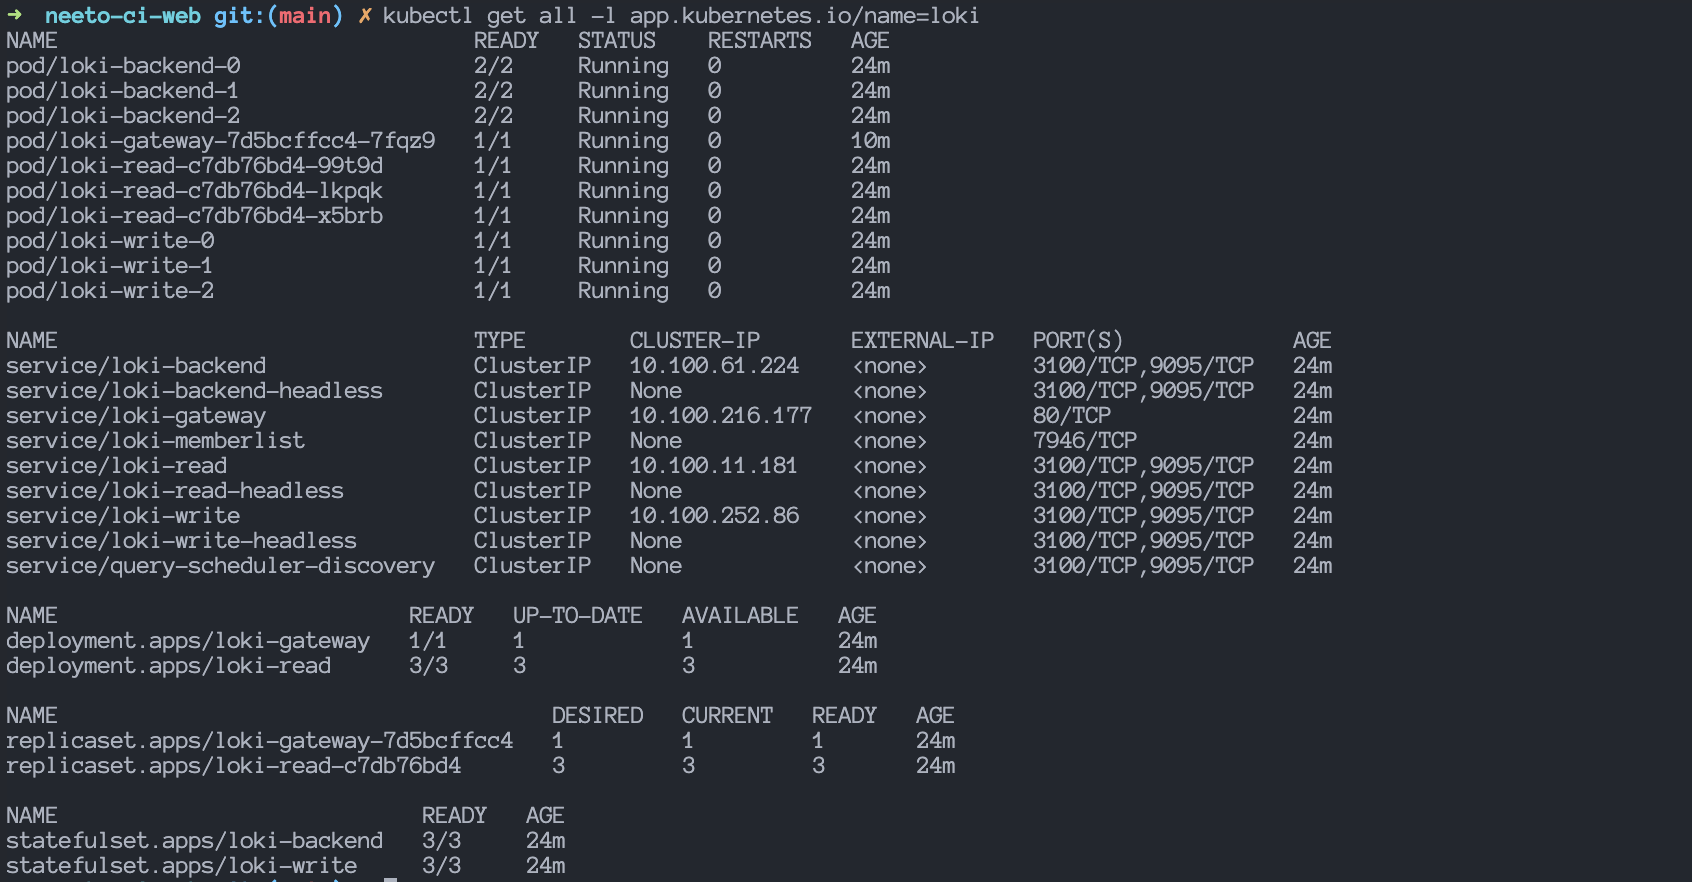
Helm chart created the following components:
- Loki read and write: Loki is installed in scalable mode by default, which includes a read-and-write component. These components can be independently scaled out.
- Gateway: Inspired by Grafana’s Tanka setup, the chart installs a gateway component by default. This NGINX component exposes Loki’s API and automatically proxies requests to the appropriate Loki components (read or write, or a single instance in the case of filesystem storage). The gateway must be enabled to provide an Ingress since the Ingress only exposes the gateway. If enabled, Grafana and log shipping agents, such as Promtail, should be configured to use the gateway. If NetworkPolicies are enabled, they become more restrictive when the gateway is active.
- Caching: In-memory caching is enabled by default. If this type of caching is unsuitable for your deployment, consider setting up memcache.
Run this command to view all the Kubernetes Services for Prometheus & Grafana:
kubectl get service -l app.kubernetes.io/name=loki
Output:
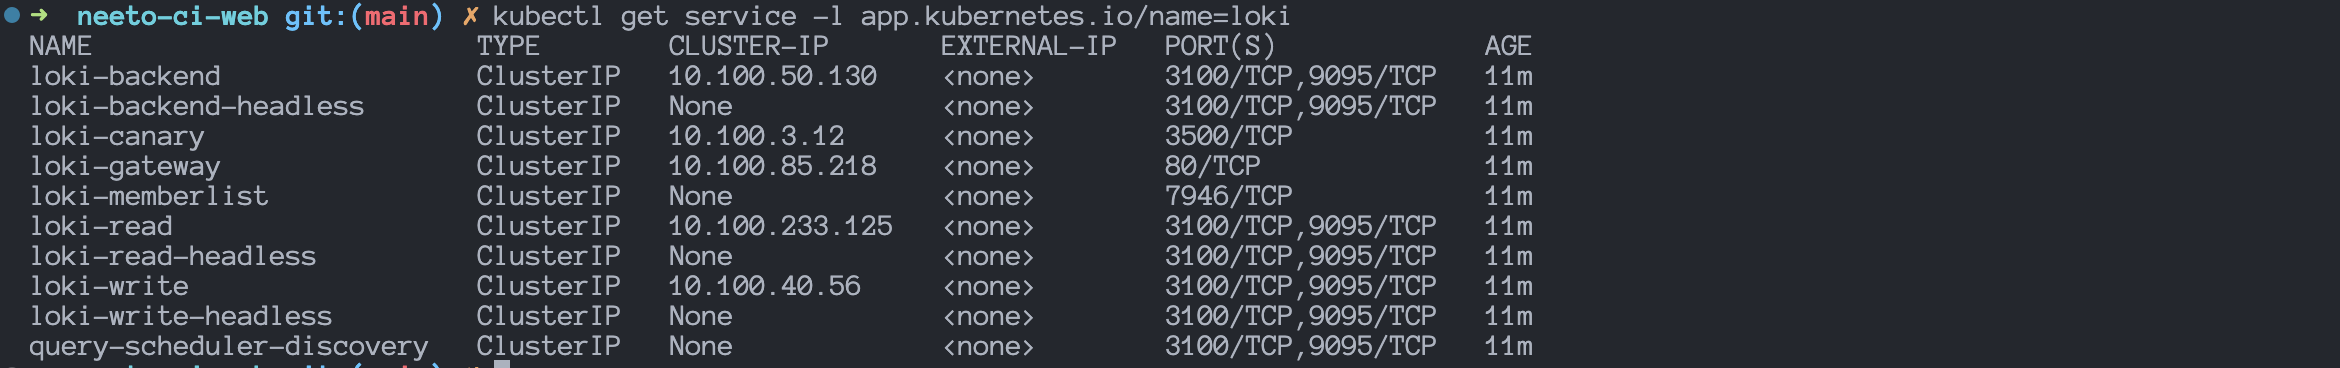
Listed services for Loki are:
- loki-backend
- loki-backend-headless
- loki-gateway
- loki-memberlist
- loki-read
- loki-read-headless
- loki-write
- loki-write-headless
- query-scheduler-discovery
The loki-gateway service will be used to add Loki as a Datasource into
Grafana.
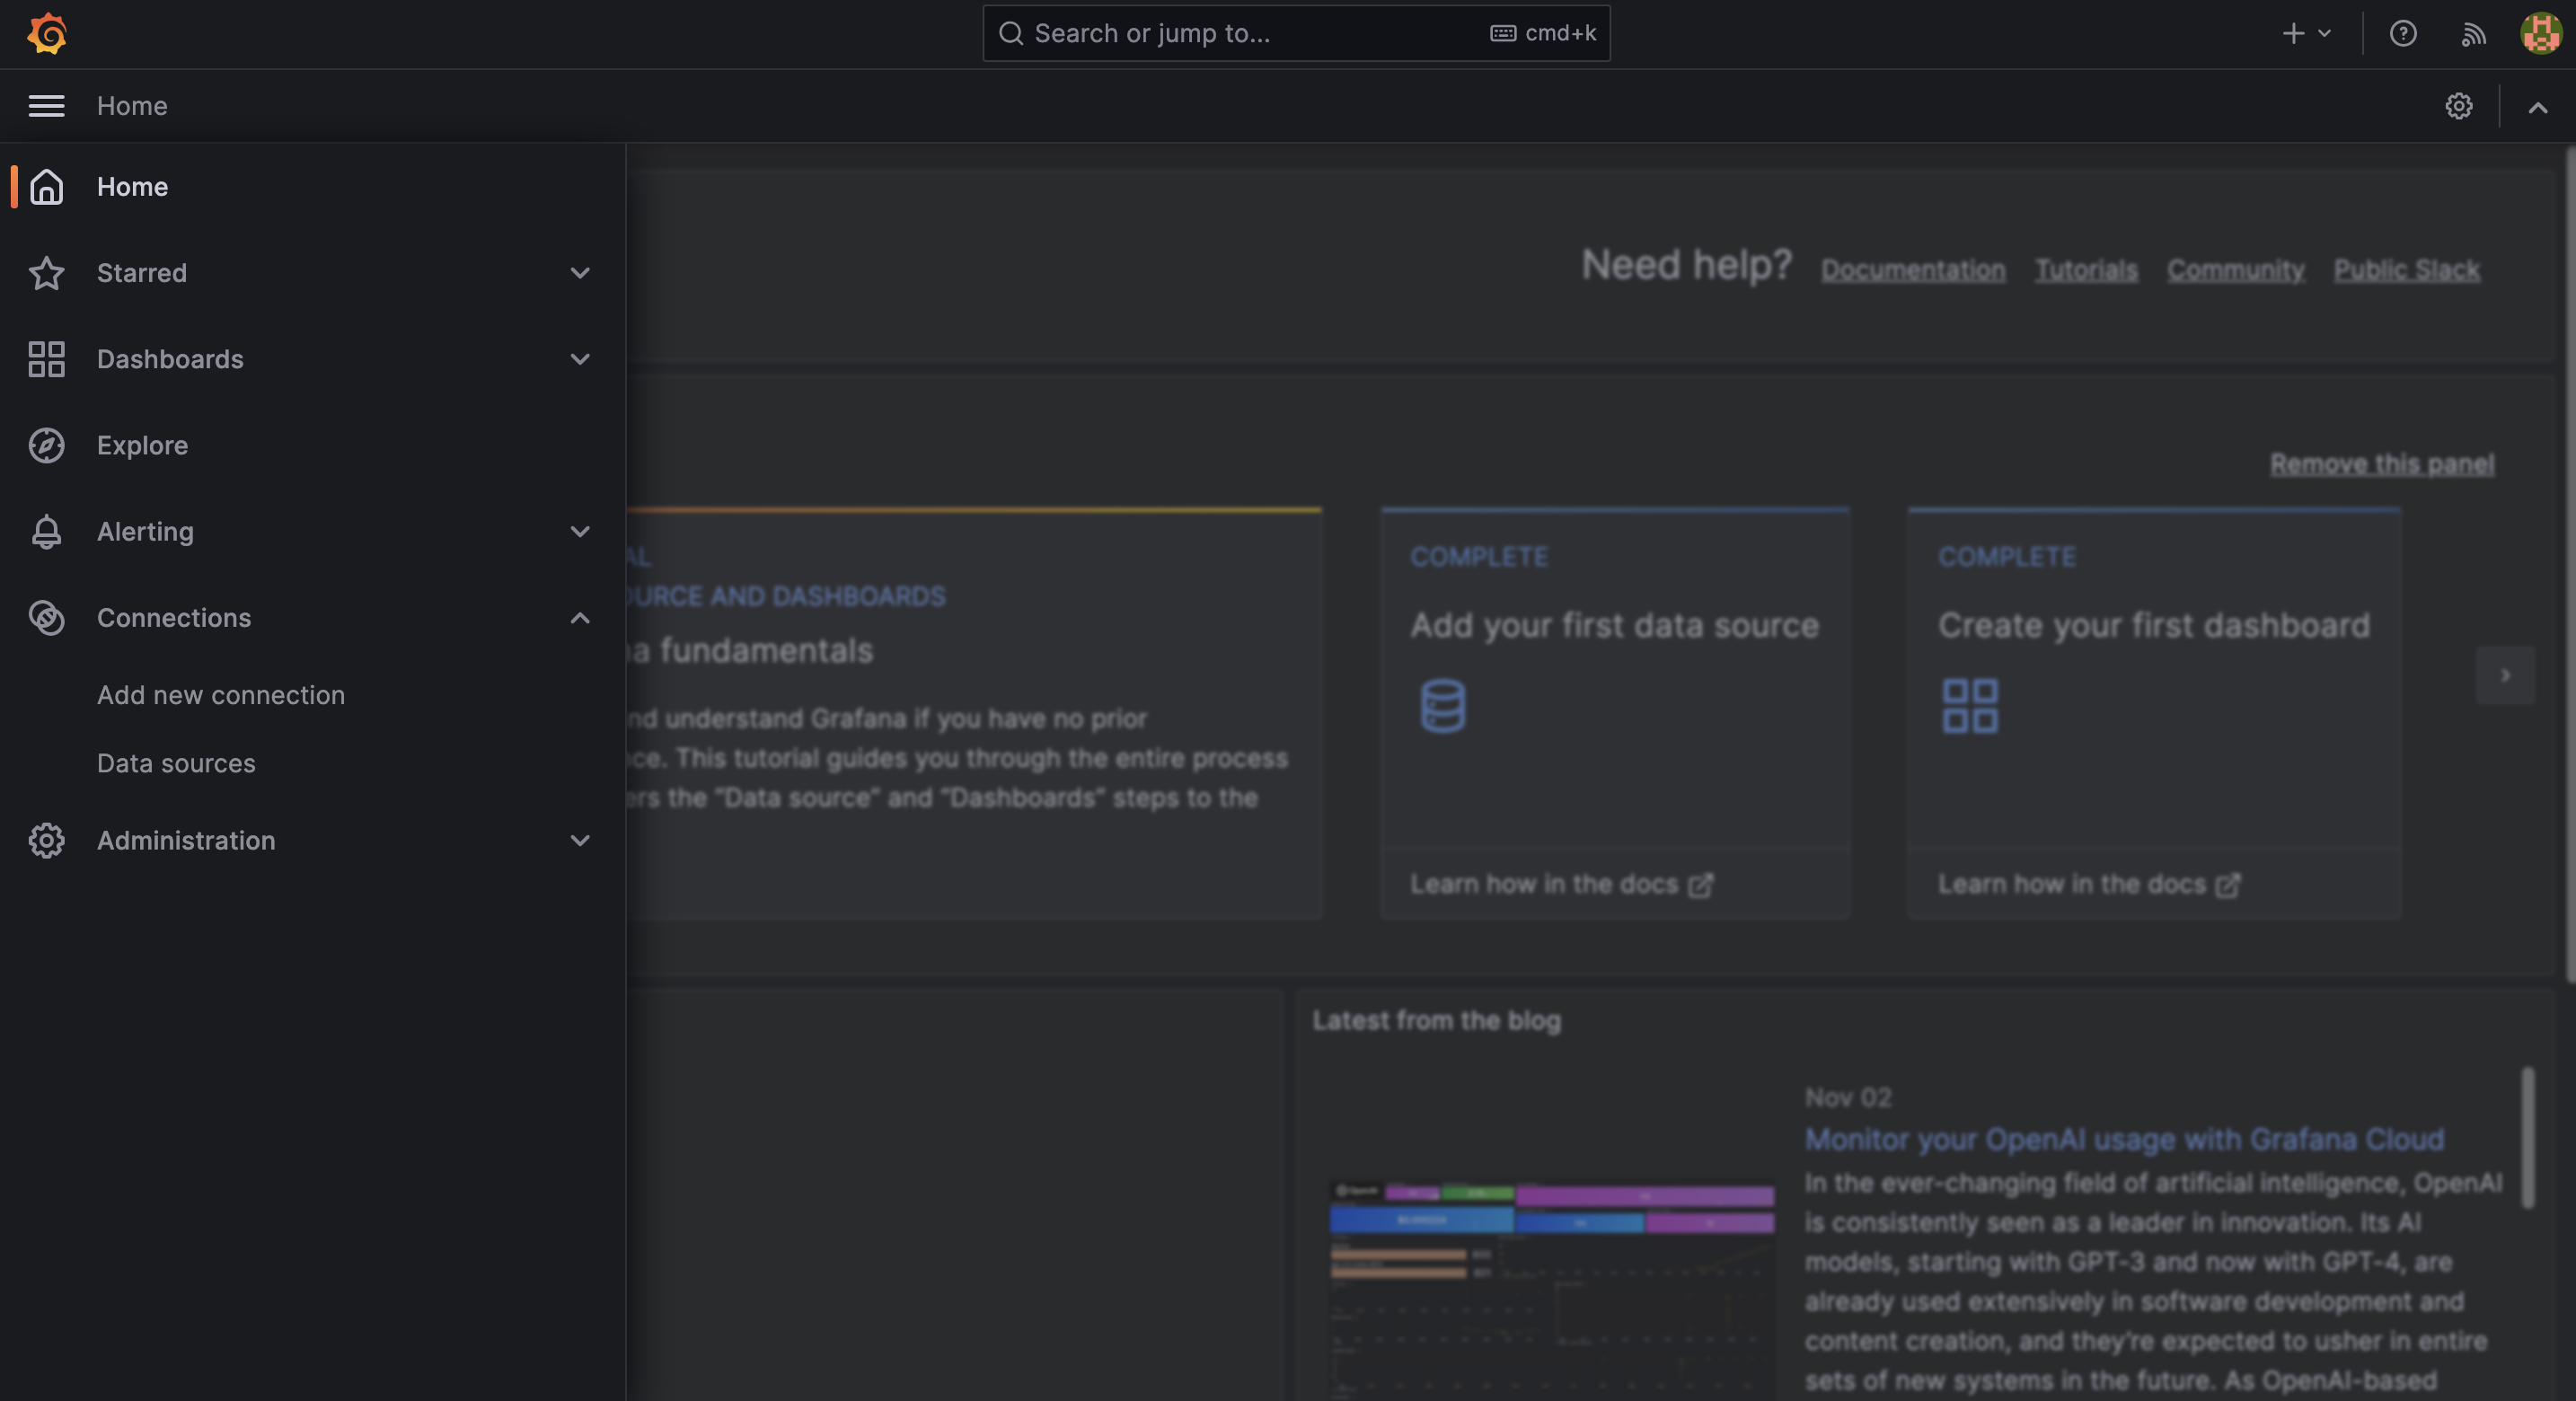
6. Adding Loki data source in Grafana
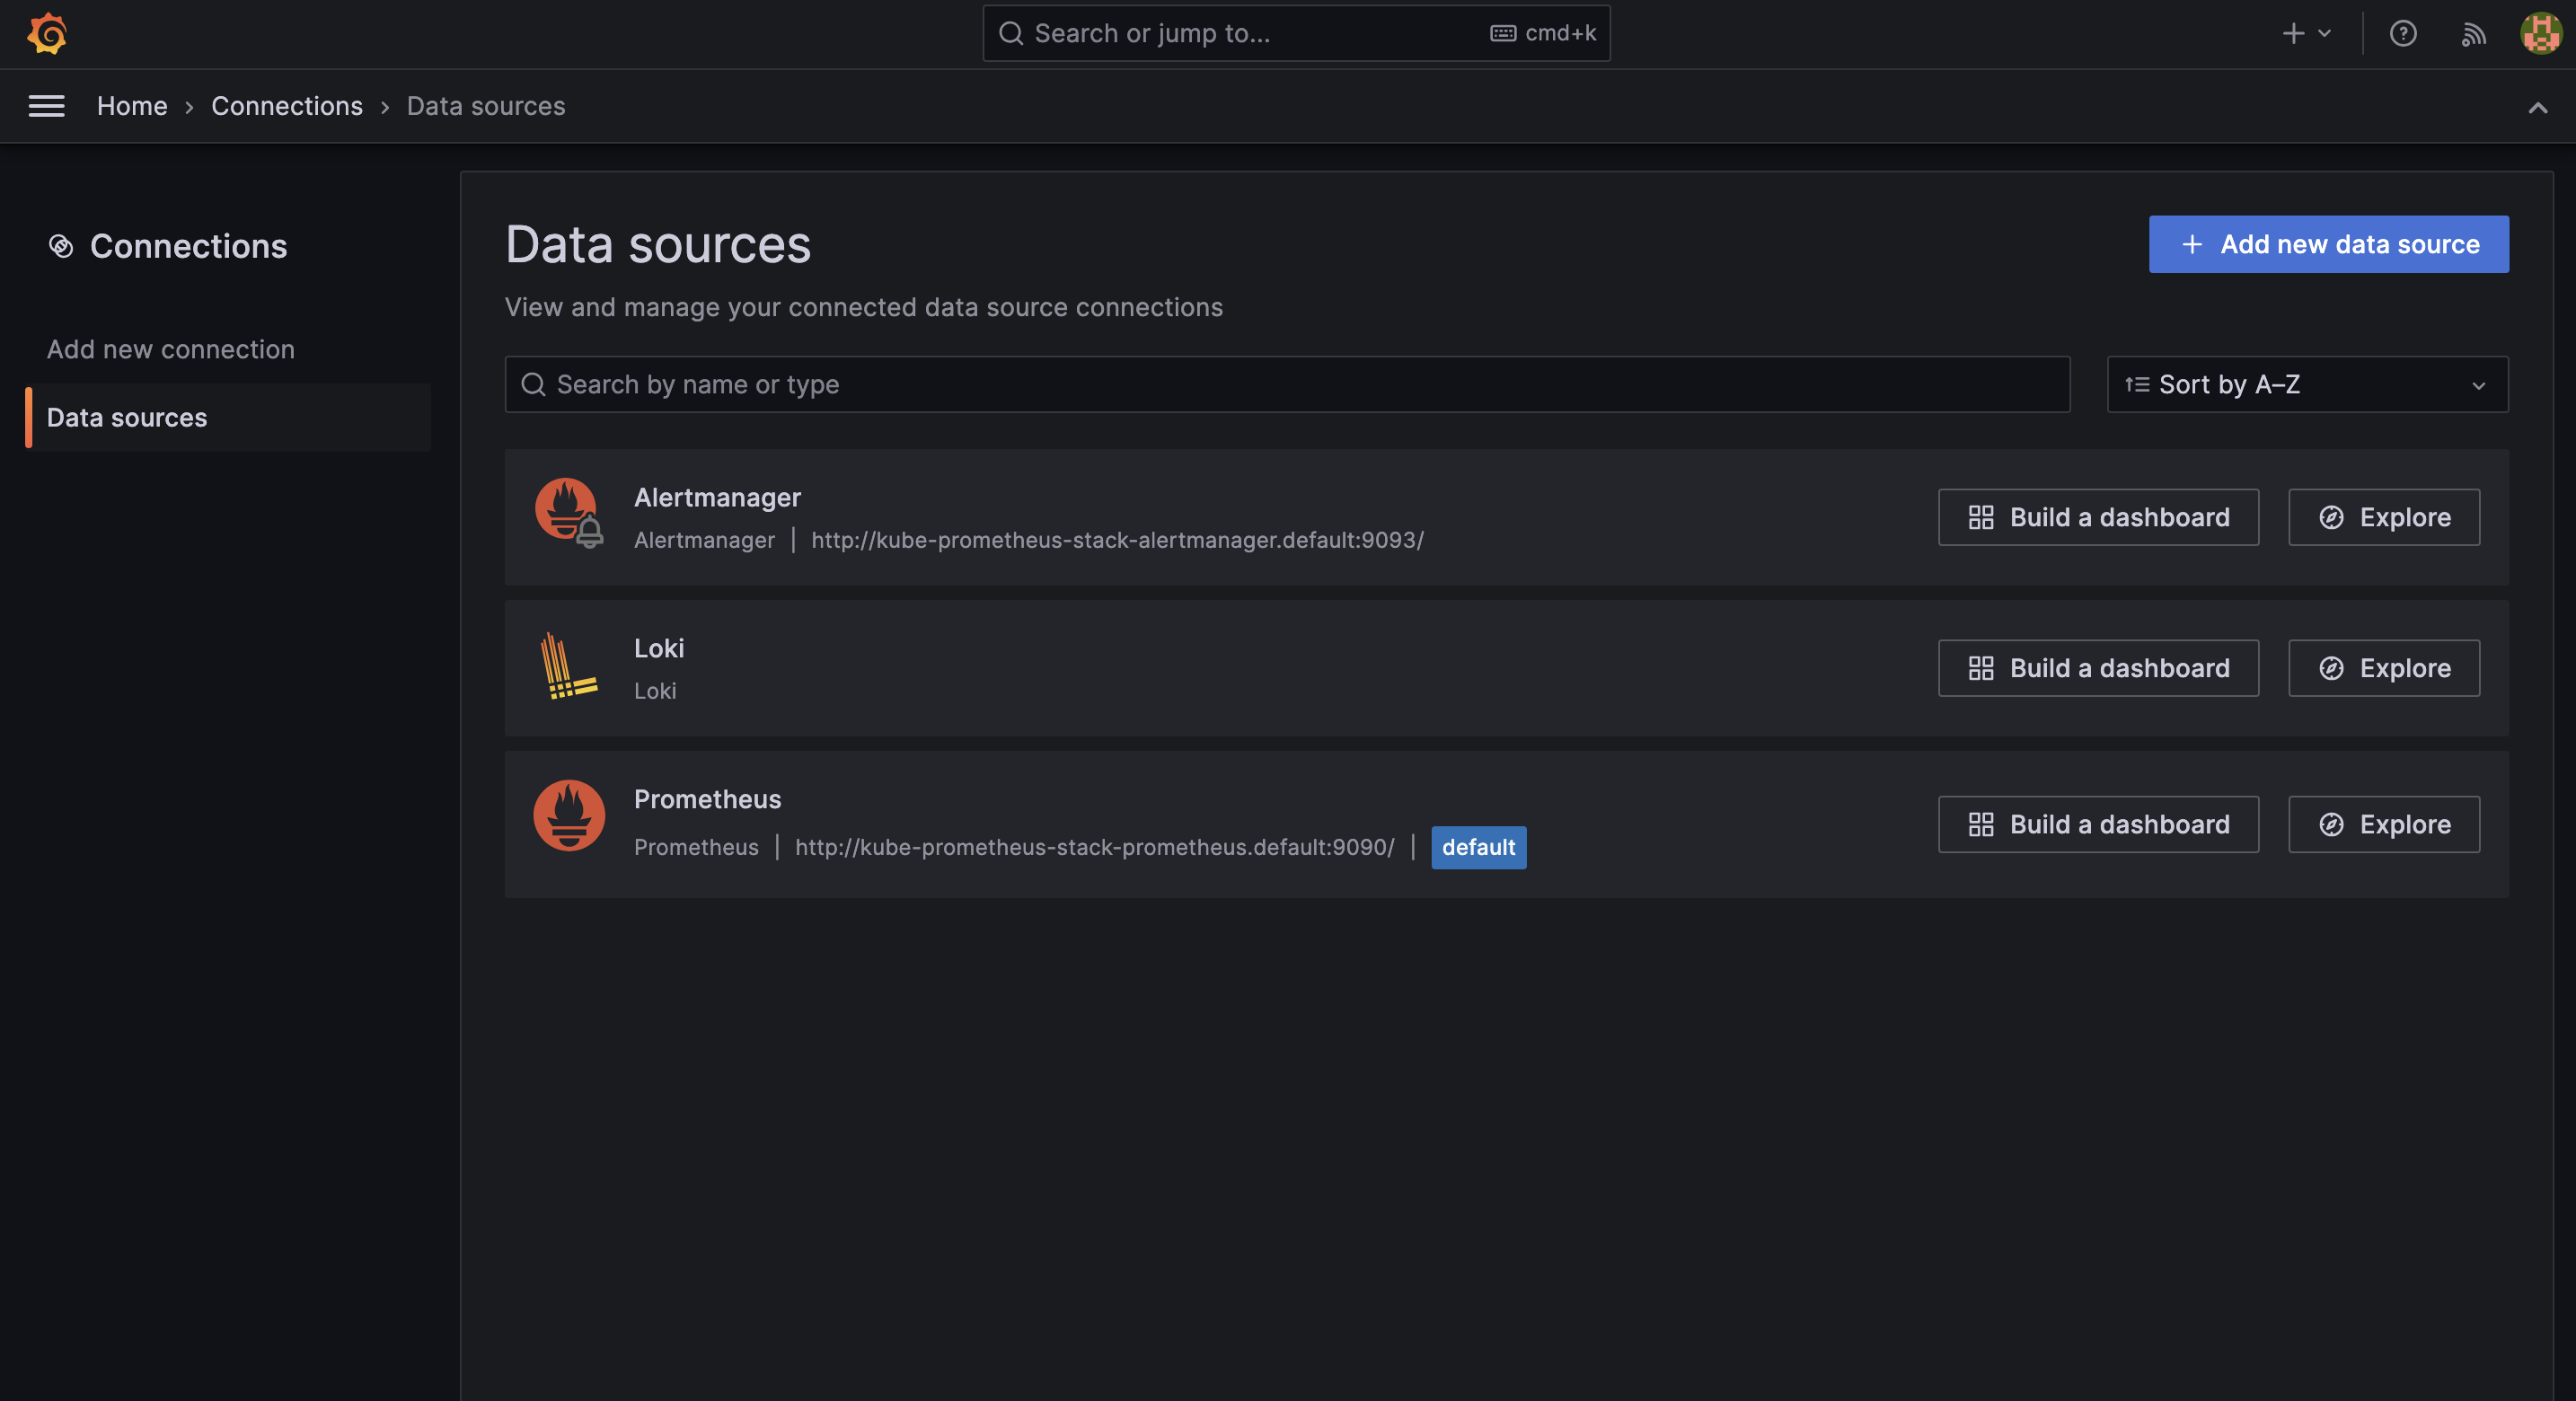
On the main page of Grafana, click on "Home". Under "Connections", you will find the "Data sources" option.
On the Data Sources page, click on the "Add new data source" button.
In the search bar, type "Loki" and search for it.
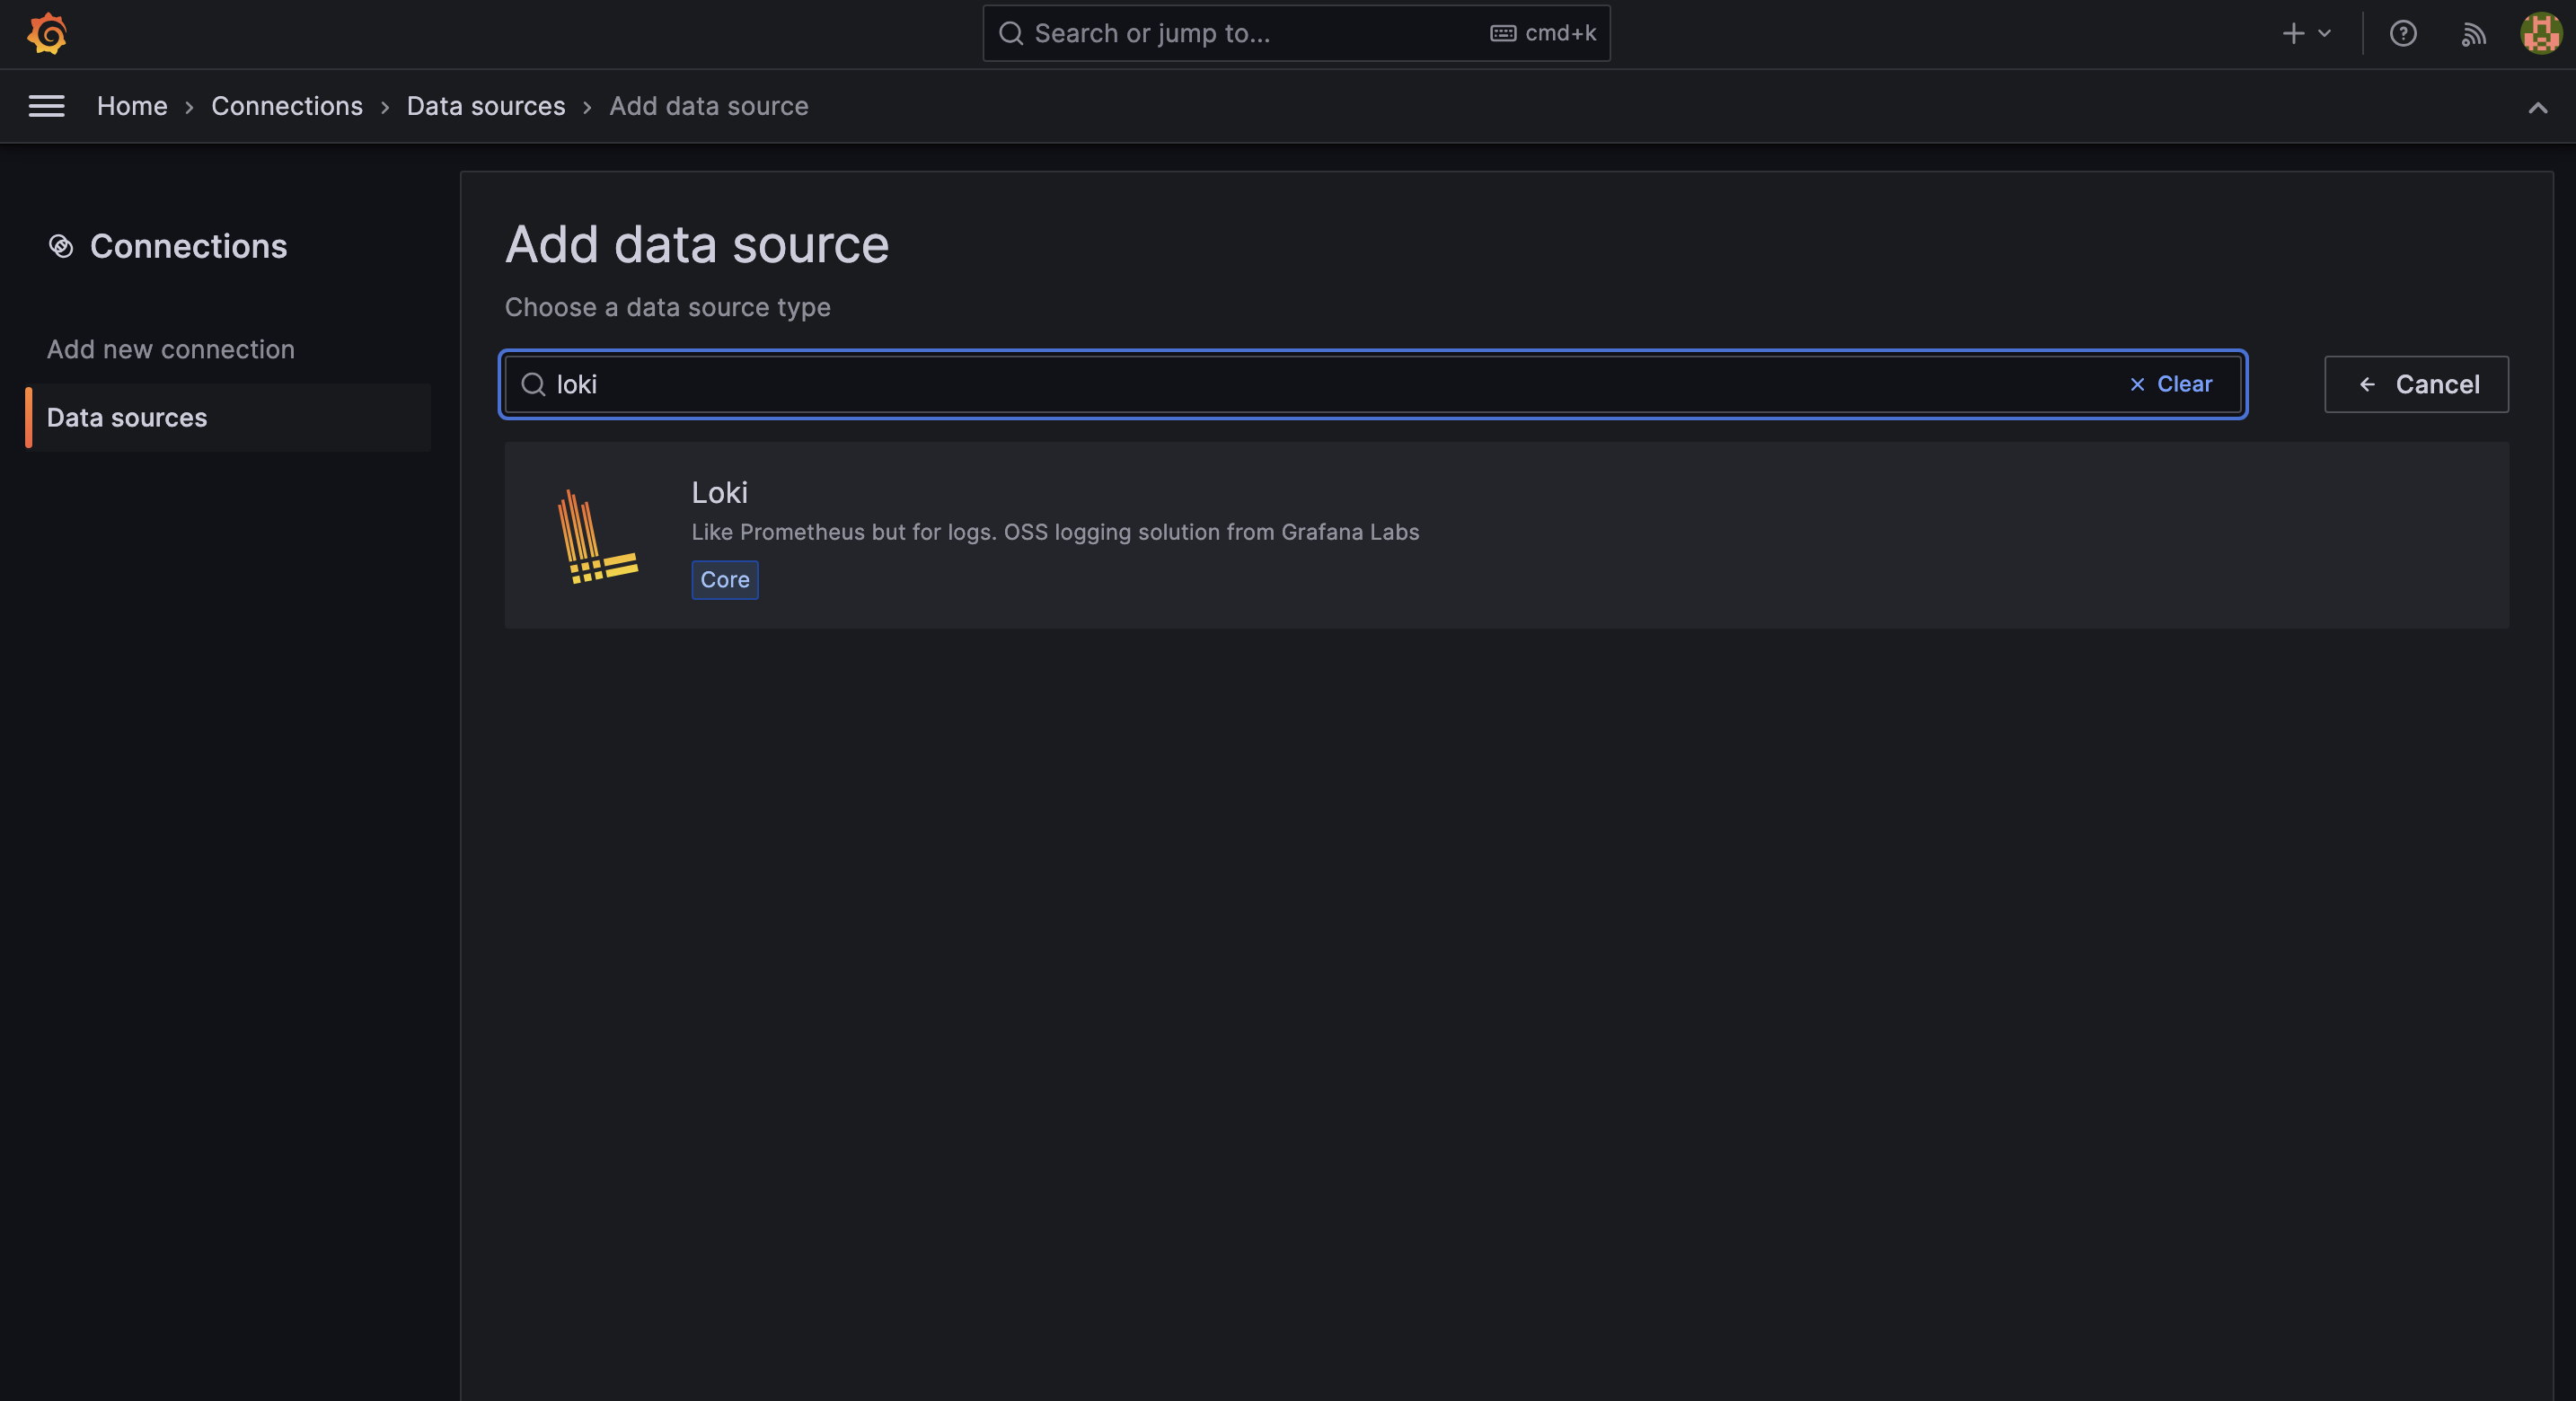
Clicking on "Loki" will redirect you to the dedicated page for the Loki data source.
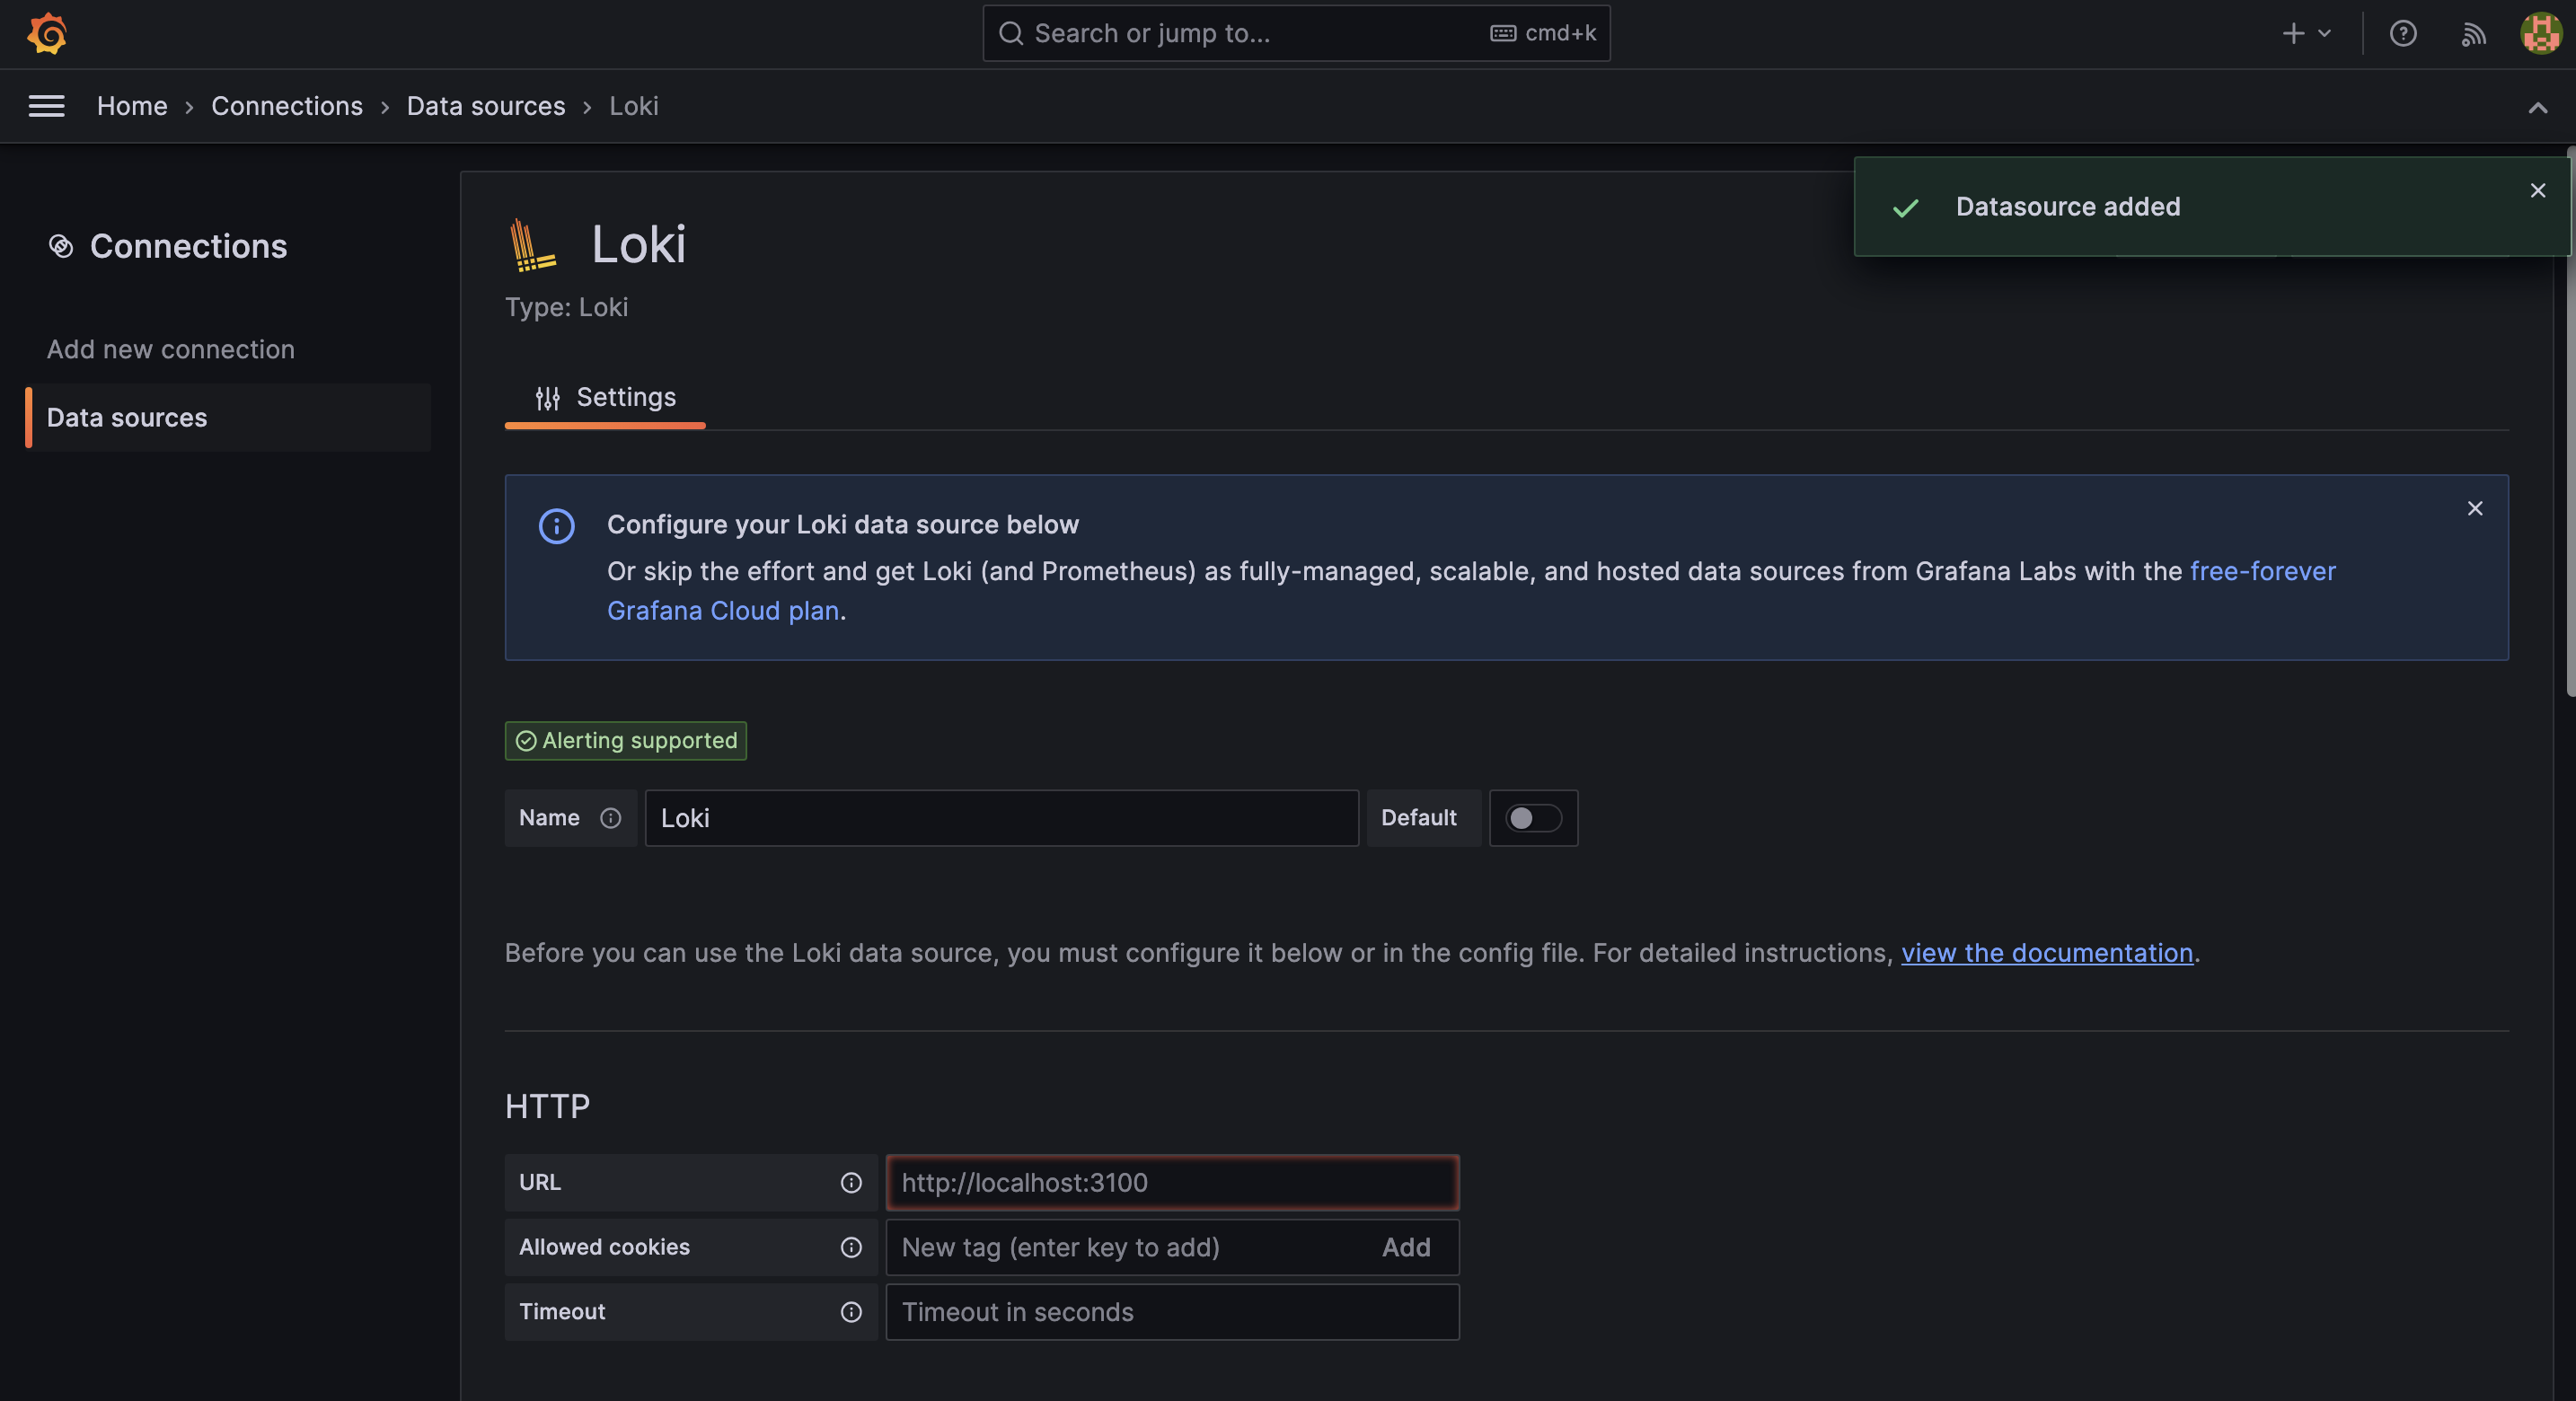
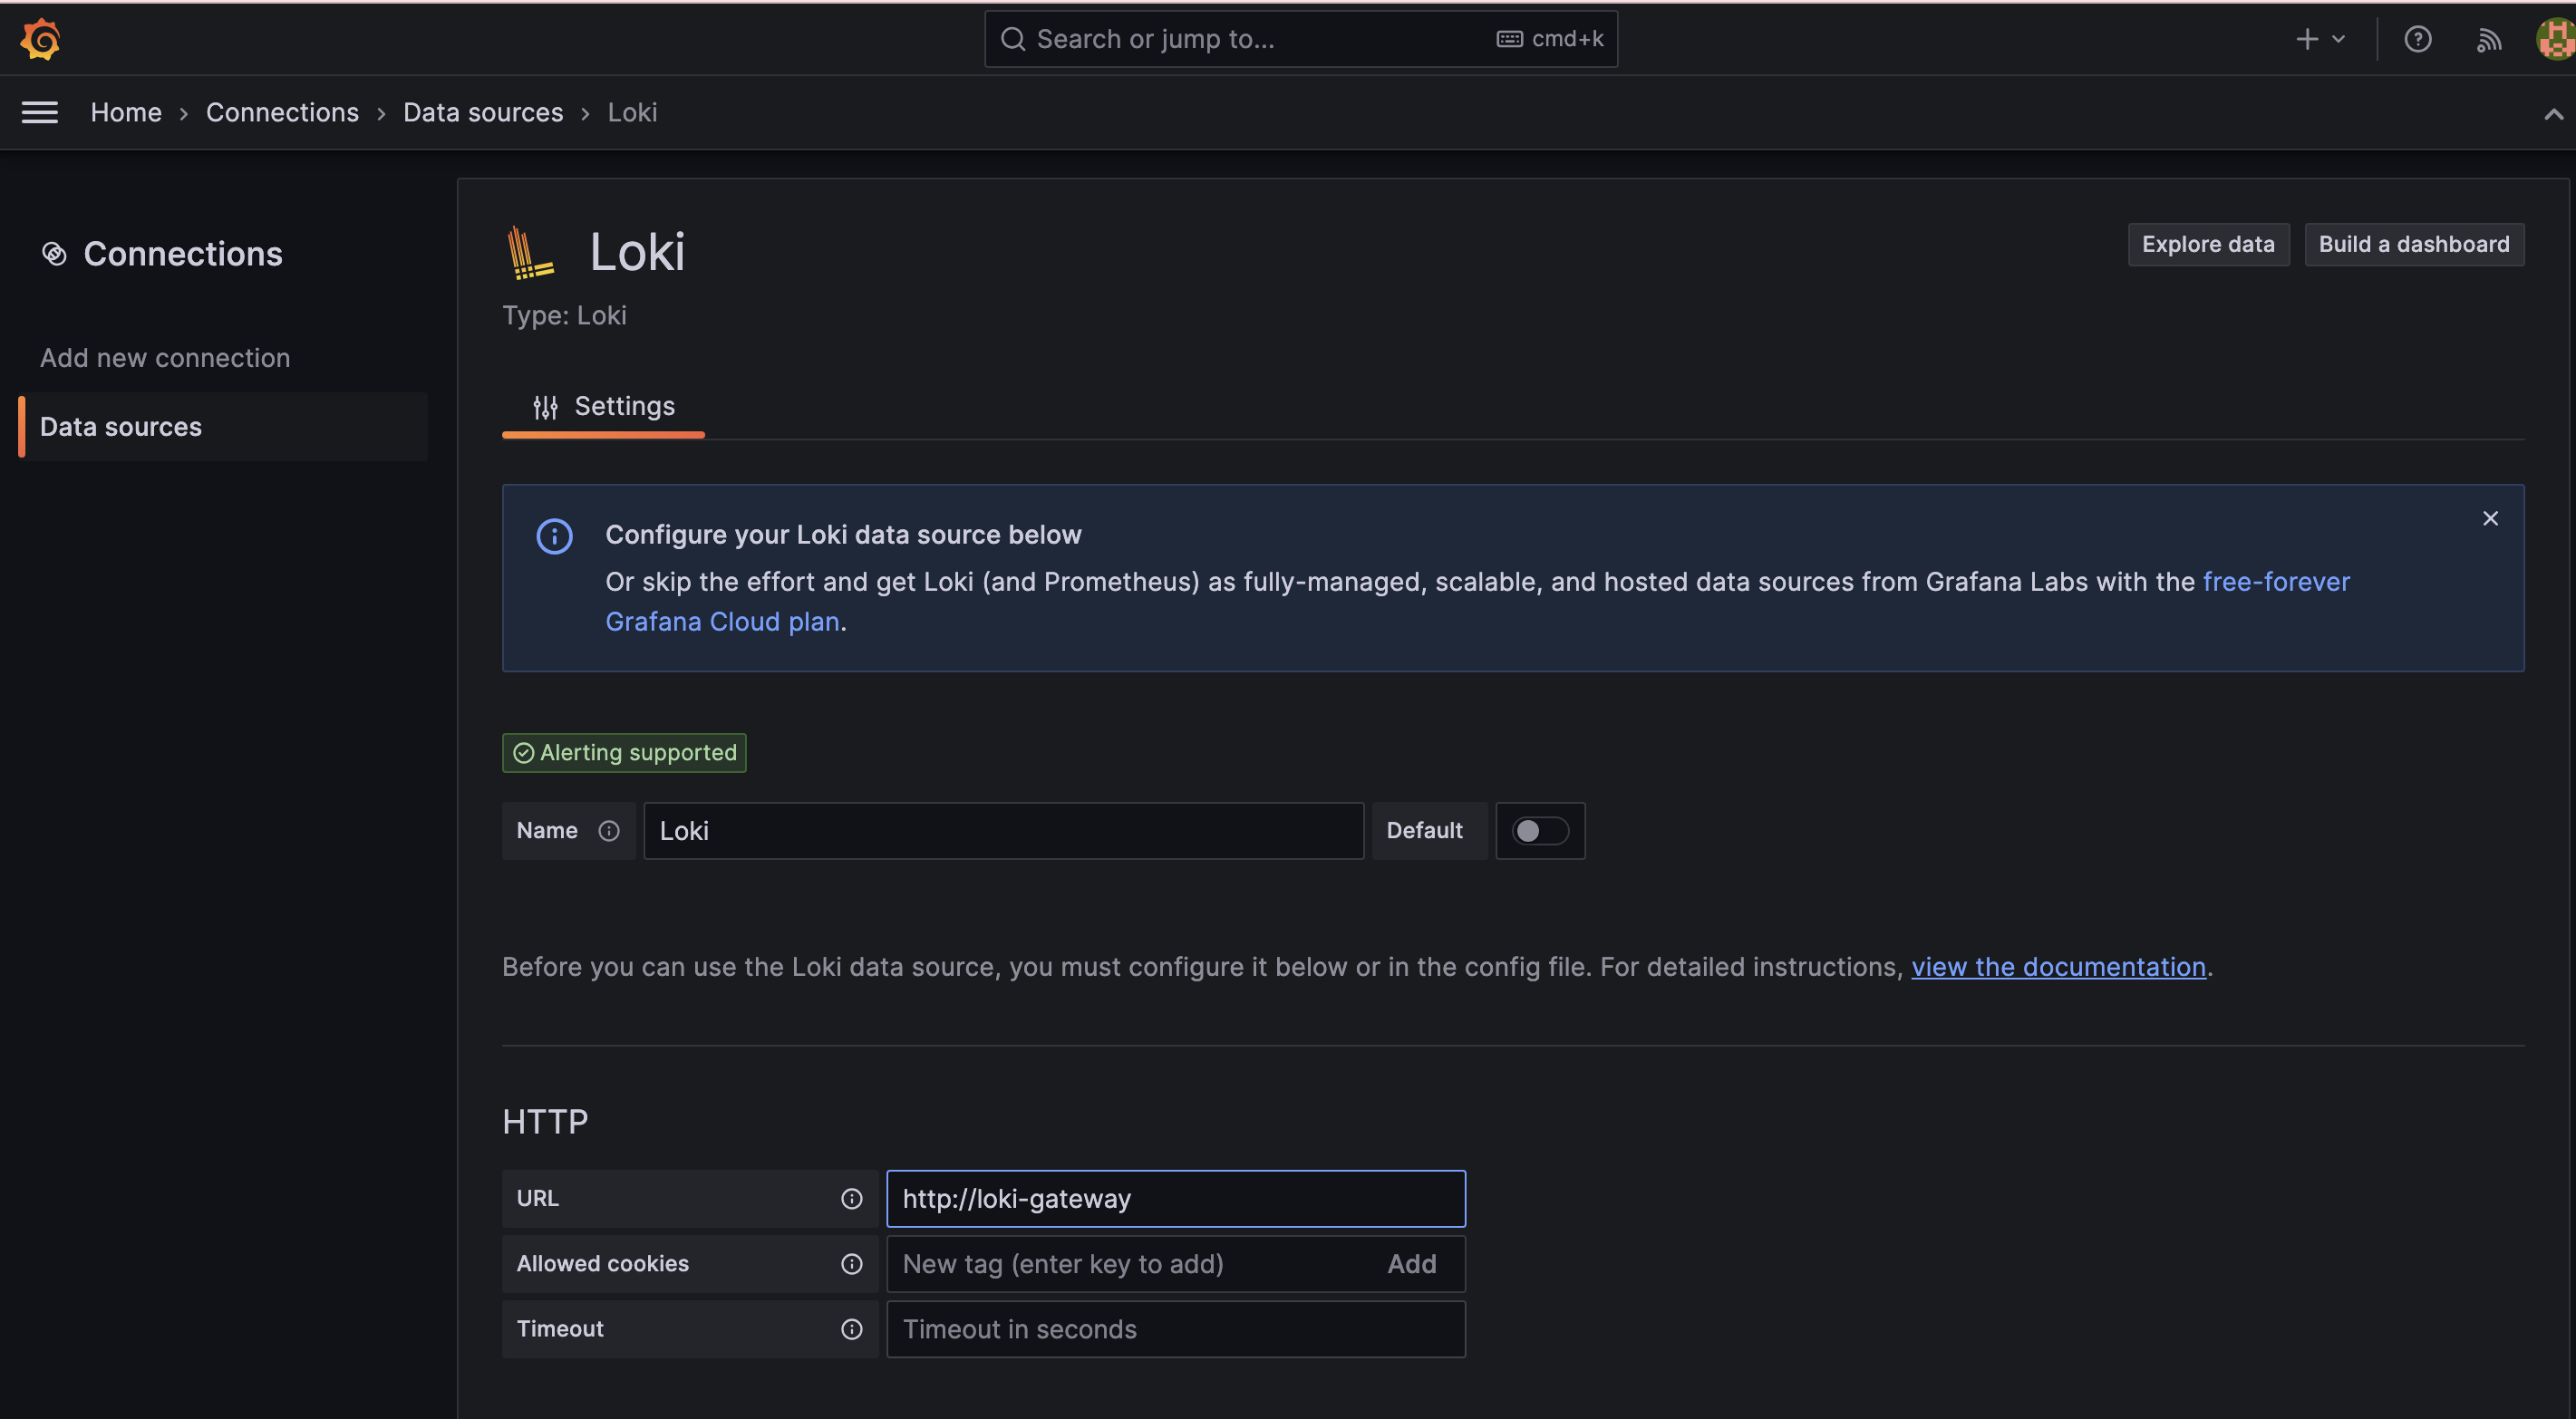
To read the metrics from Loki, we will use the loki-gateway service. Add the
URL of the service as http://loki-gateway.
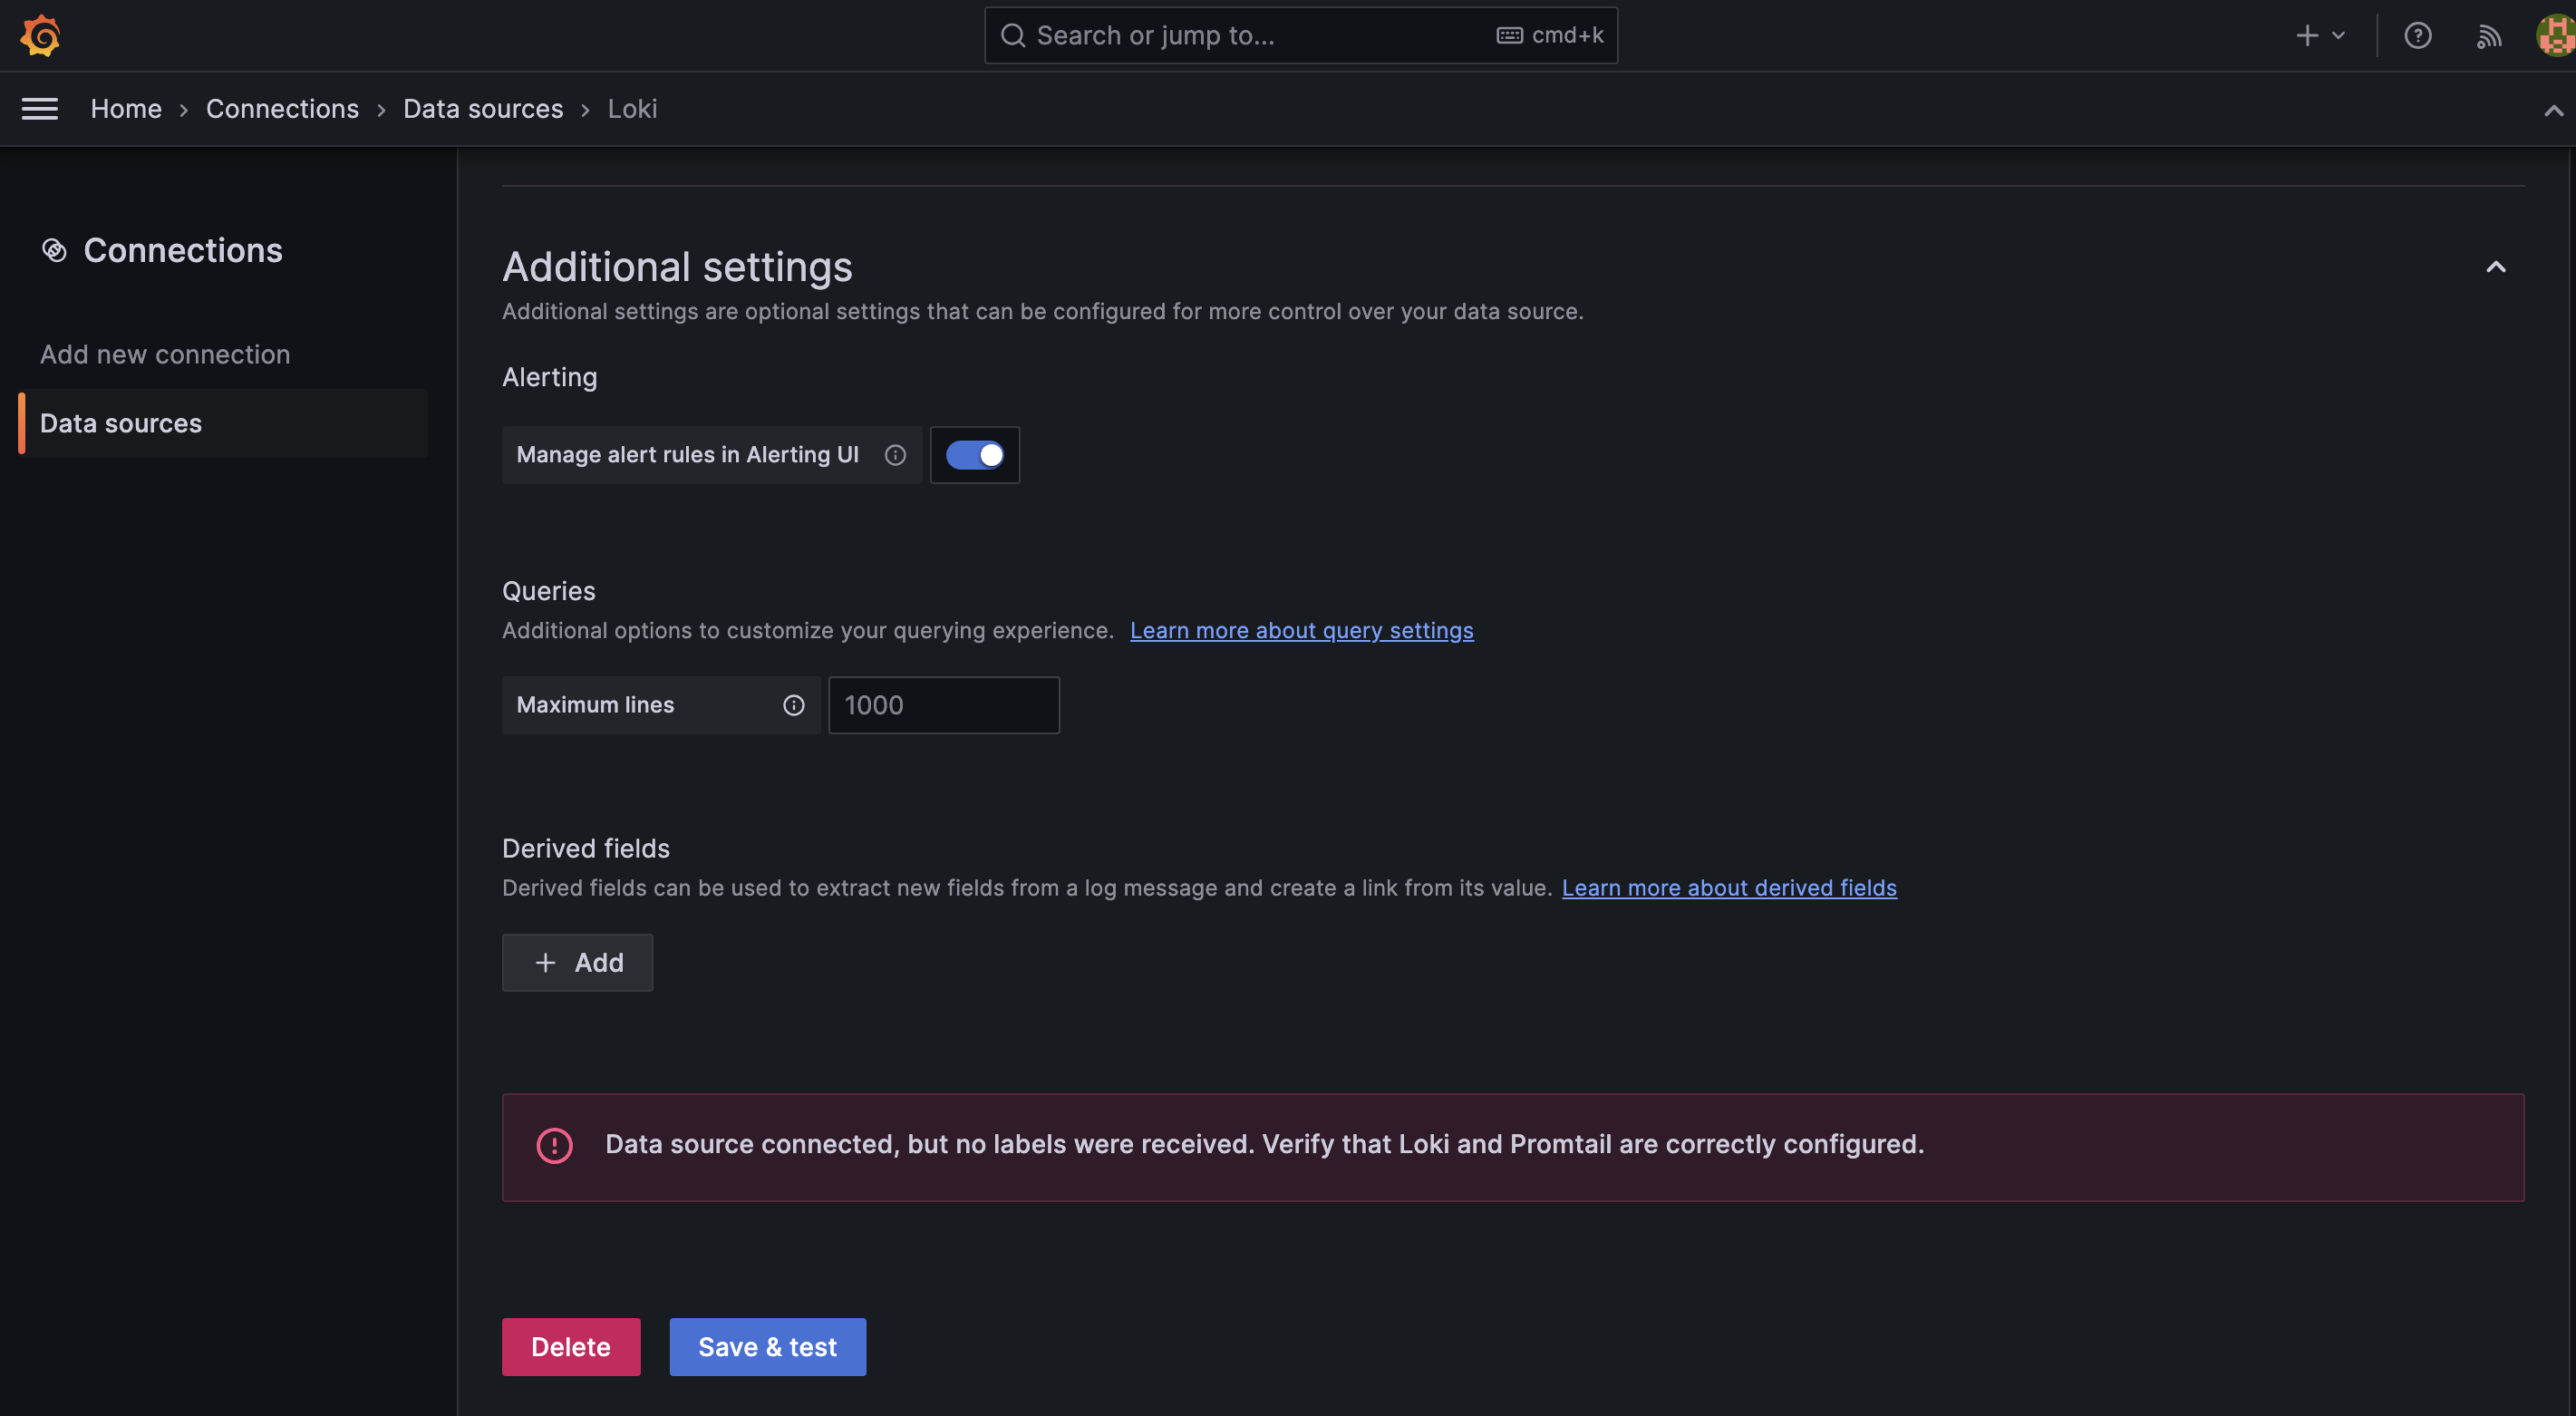
After clicking on the "Save & test" button, you will receive a toastr message shown in the image below. This message is received because no clients have been created for Loki yet.
7. Install Kubernetes event exporter using the helm chart
Create an event-exporter-values yaml file with the below snippet
config:
  leaderElection: {}
  logLevel: debug
  logFormat: pretty
  metricsNamePrefix: event_exporter_
  receivers:
    - name: "dump"
      file:
        path: "/dev/stdout"
        layout: {}
    - name: "loki"
      loki:
        url: "http://loki-gateway/loki/api/v1/push"
        streamLabels:
          source: kubernetes-event-exporter
          container: kubernetes-event-exporter
  route:
    routes:
      - match:
          - receiver: "dump"
          - receiver: "loki"
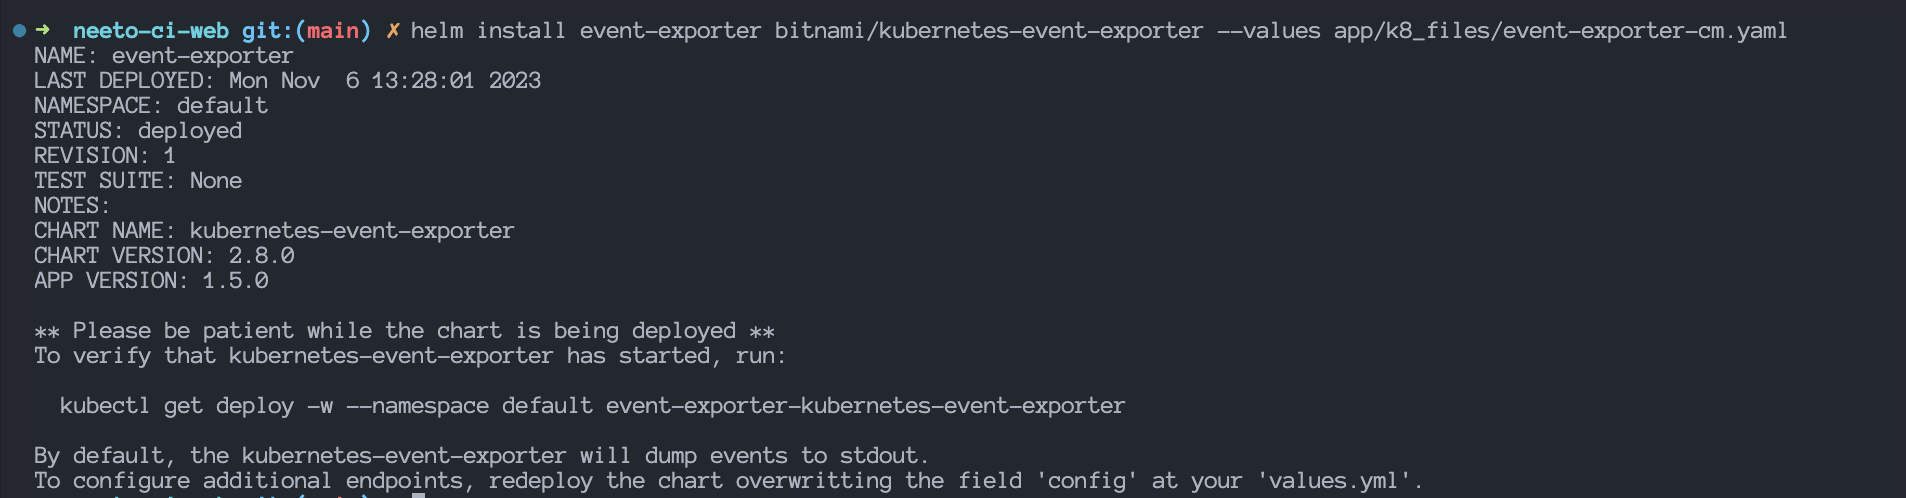
With the use of the above snippet, run this command to install the Kubernetes event exporter in your Kubernetes Cluster.
helm repo add bitnami [https://charts.bitnami.com/bitnami](https://charts.bitnami.com/bitnami)
helm install event-exporter bitnami/kubernetes-event-exporter --values event-exporter.yaml
Output:
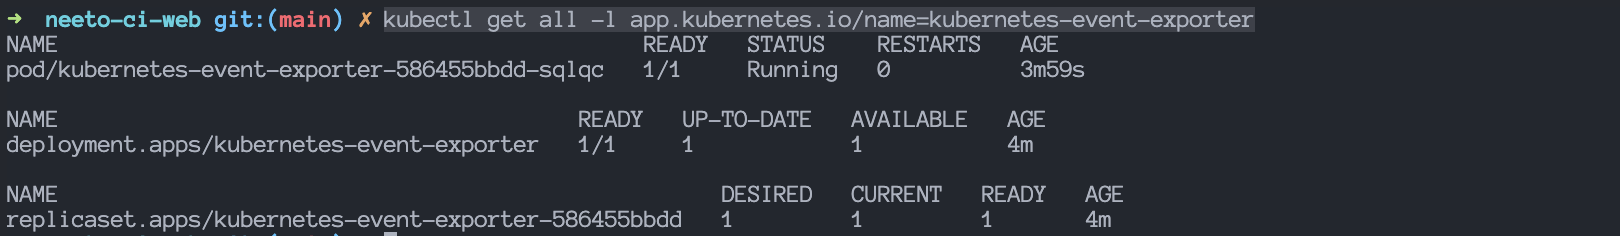
To view all the resources created by the above helm chart, run this command:
kubectl get all -l app.kubernetes.io/name=kubernetes-event-exporter
Output:
To view the logs of the event exporter POD, run this command:
kubectl logs -f pod/kubernetes-event-exporter-586455bbdd-sqlqc
Note: Replace kubernetes-event-exporter-586455bbdd-sqlqc with your pod name.
Output:
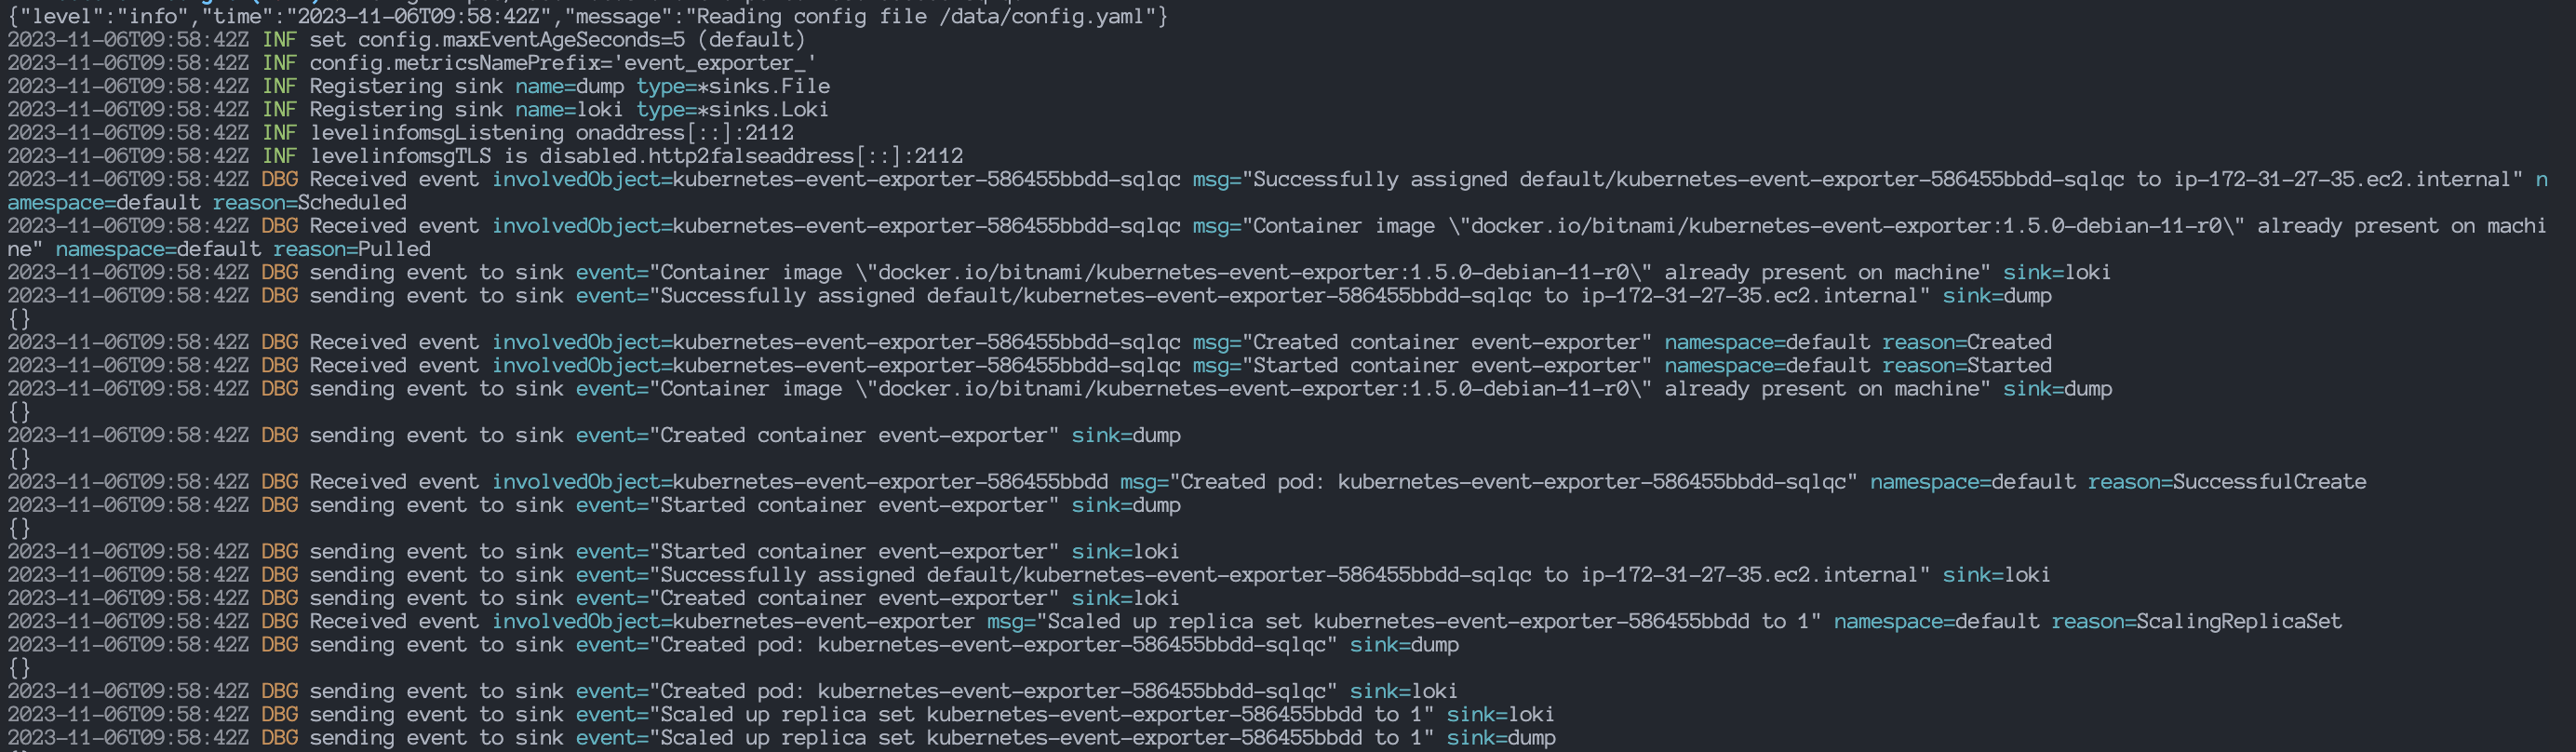
As you can see in the above image, the event exporter is working and running fine. Event logs are being sent to both the receivers that we’d configure in the values YAML file.
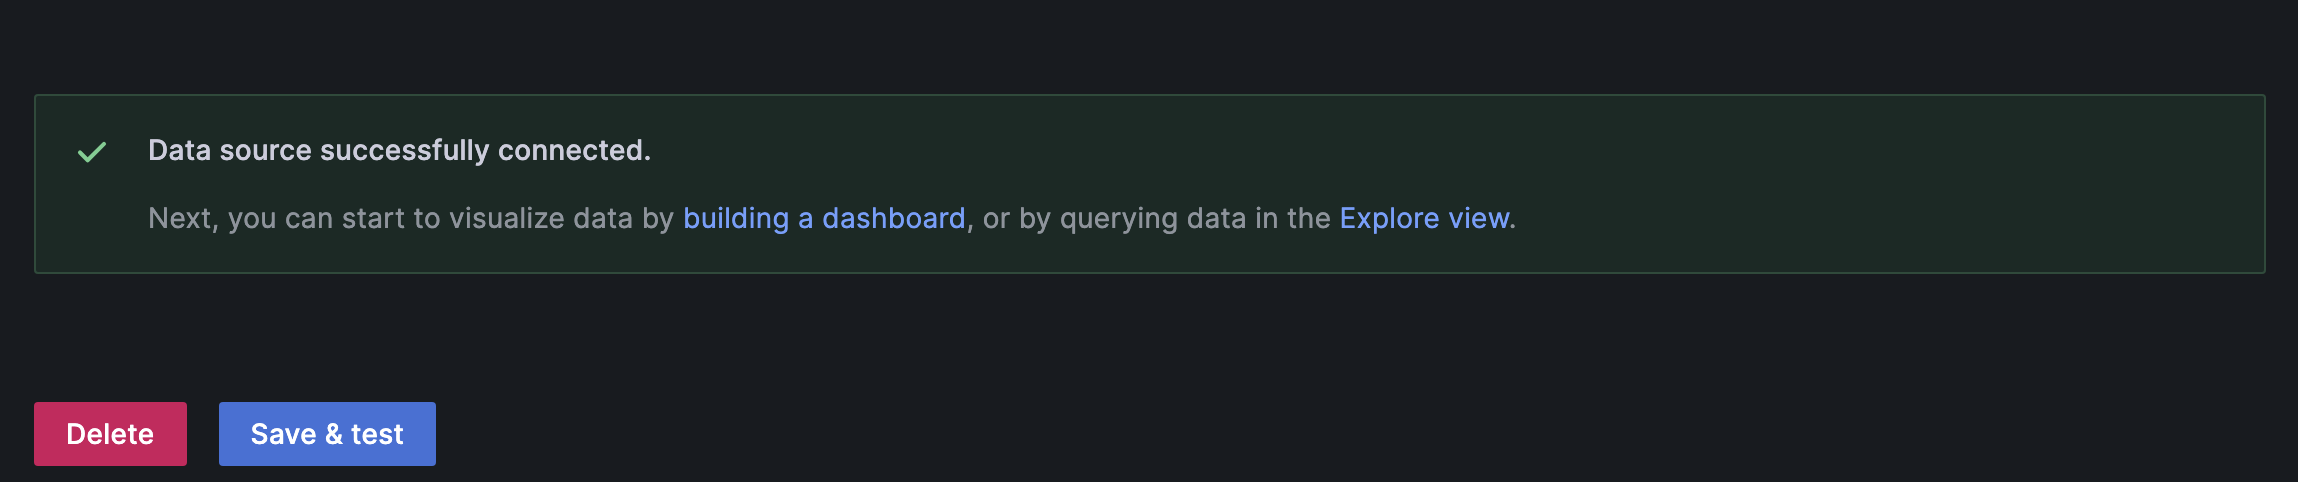
Once the POD is created & running, we can go back to the Loki data source under Connections > Data Sources page.
Again click on the “Save & test” button & this time you’ll receive a success toastr message.
Output:
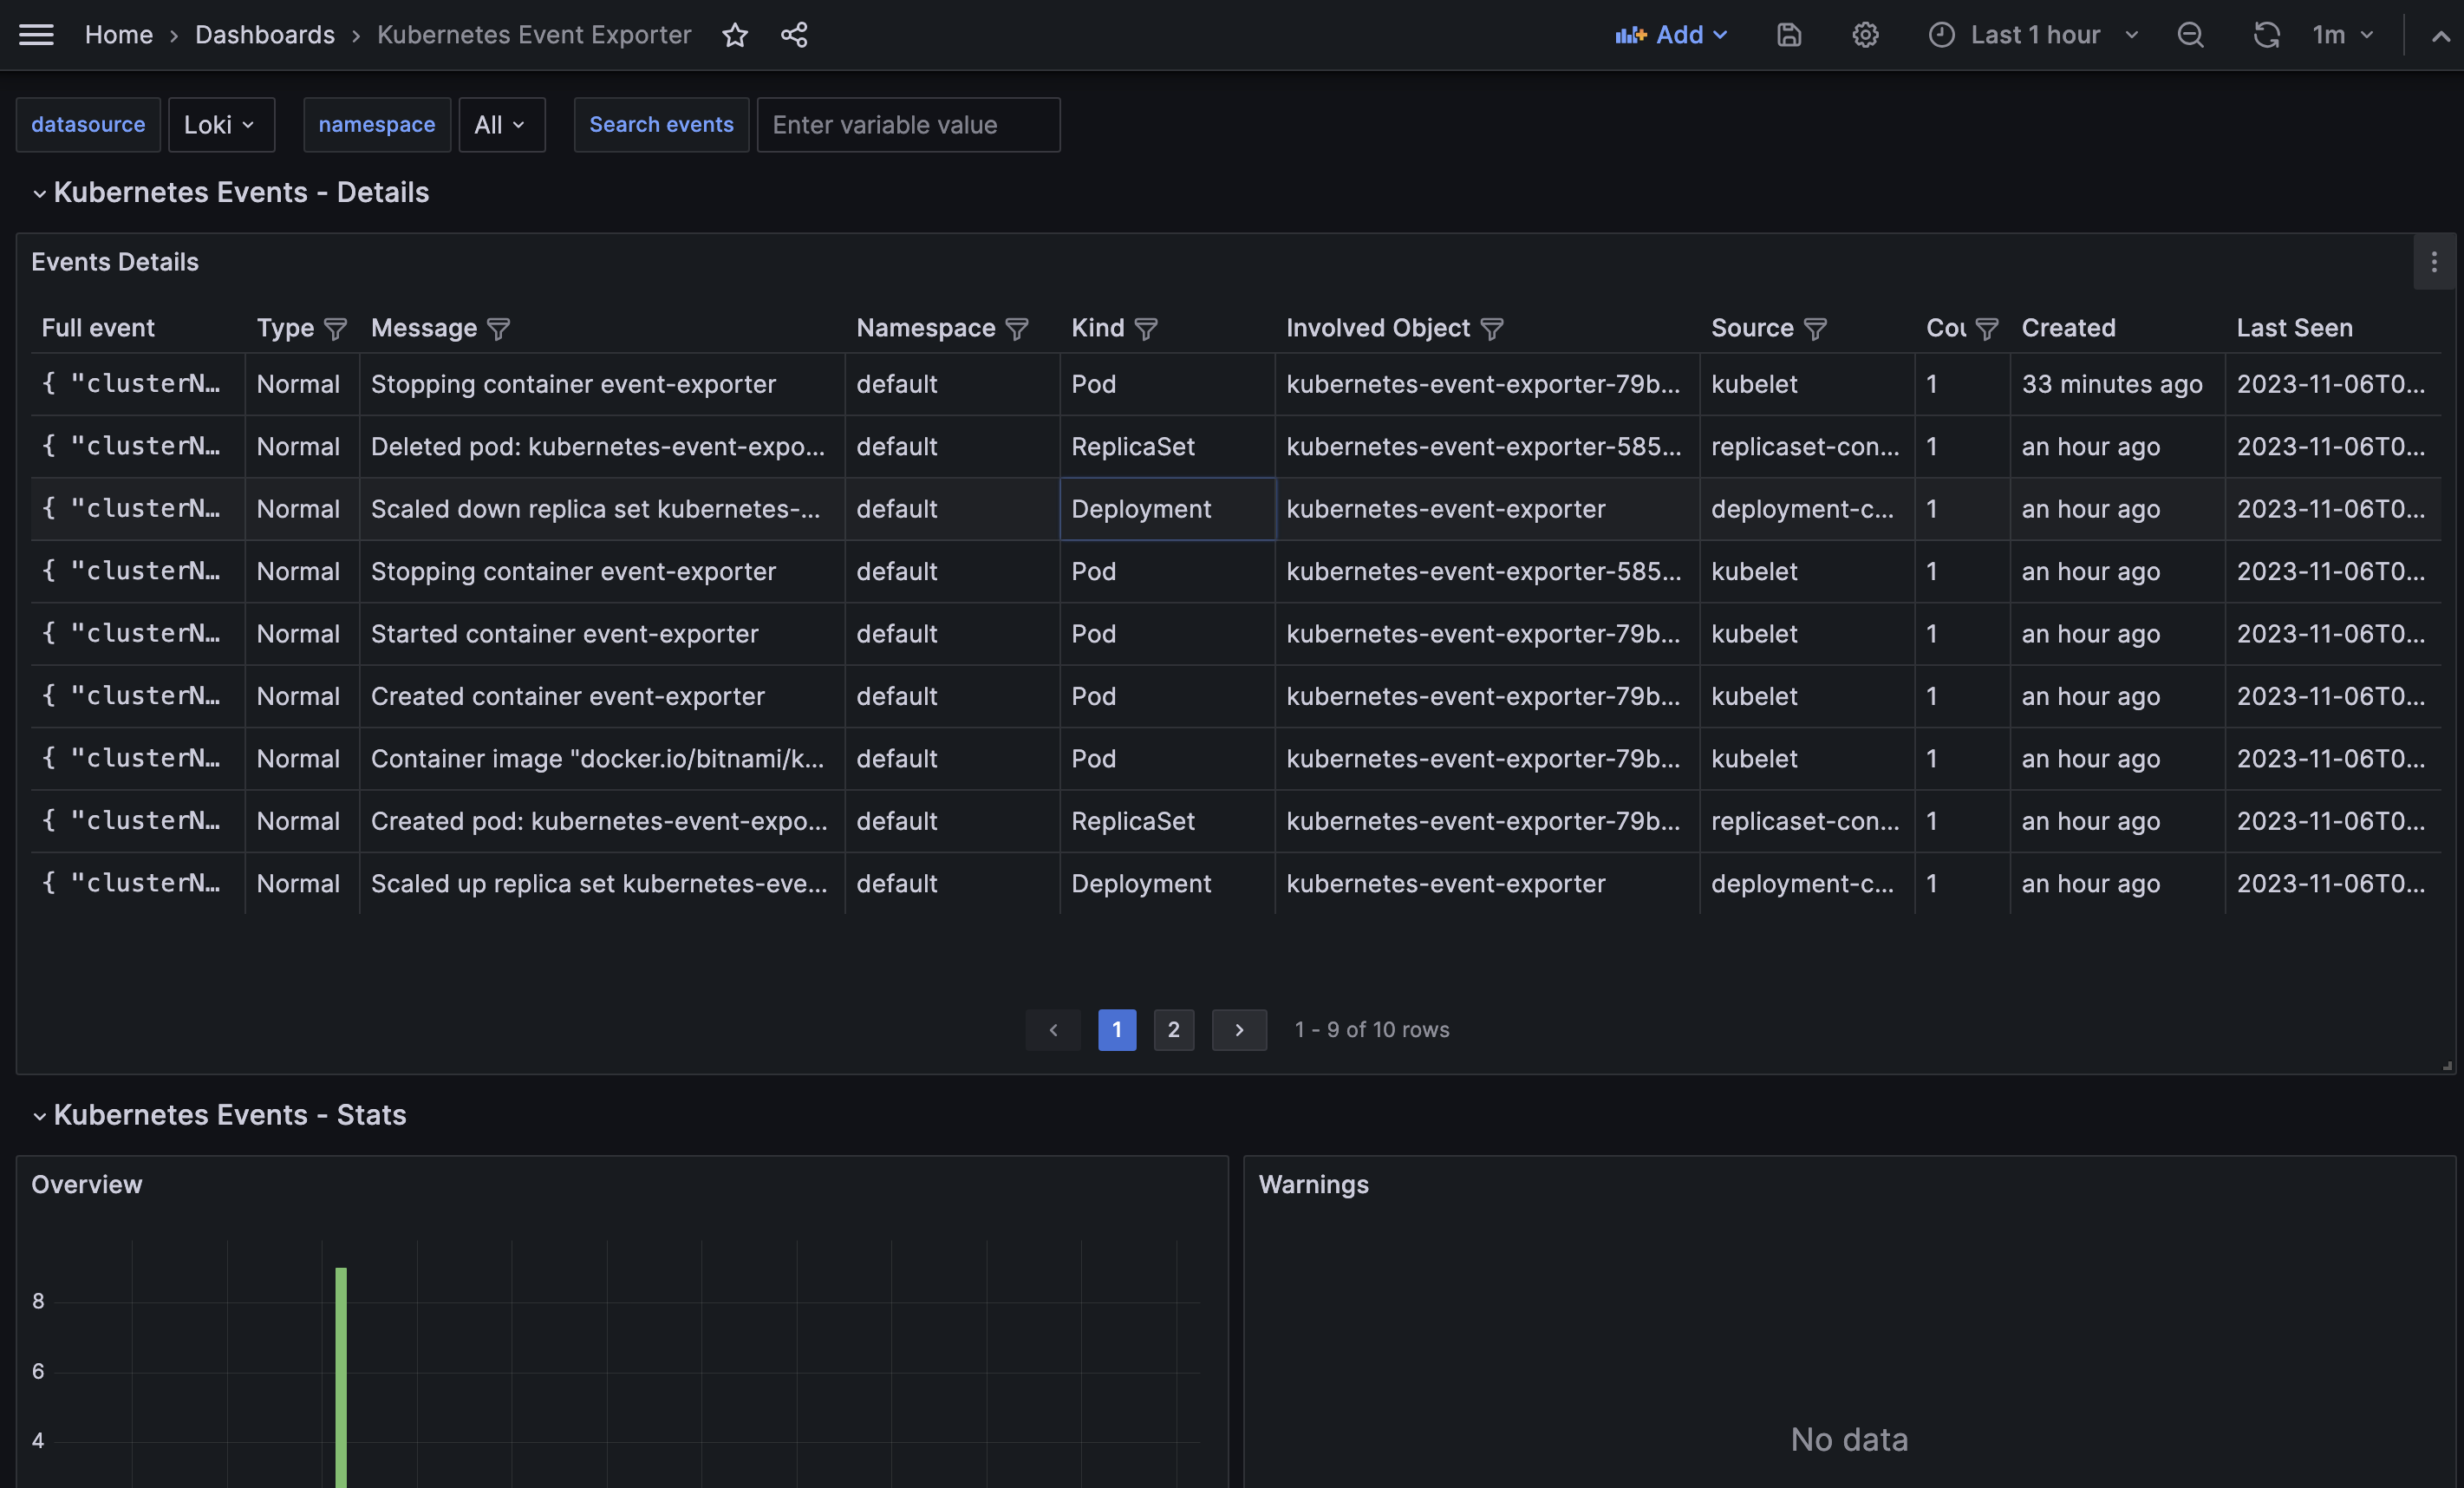
8. Kubernetes event exporter dashboard
We will import this dashboard into Grafana to monitor and track the events received from the Kubernetes cluster. You can go through this blog if you want to learn how to import an existing dashboard into Grafana.
After successfully importing the dashboard, you can view all the events from the cluster, as shown in the image below. Additionally, you can filter the events based on any value within any interval.
Kubernetes Event Exporter
Conclusion
In this blog post, we discussed the process of setting up Grafana Loki and Kubernetes Event exporter. We covered various steps, such as creating a policy for Grafana Loki, creating a role with the necessary permissions, and adding Grafana using the Helm chart, installing the Loki stack, and adding Loki as a data source in Grafana, installing Kubernetes event exporter using the Helm chart, and finally, setting up the Kubernetes event exporter dashboard in Grafana.
By following the steps outlined in this blog post, you can effectively monitor and track events from your Kubernetes cluster using Grafana Loki and Kubernetes Event exporter. This setup provides valuable insights and helps in troubleshooting and analyzing events in your cluster.
If you have any questions or feedback, please feel free to reach out. Happy monitoring!
Follow @bigbinary on X. Check out our full blog archive.