Building the metrics dashboard in NeetoDeploy with Prometheus
January 9, 2024
We are building NeetoDeploy, a compelling alternative to Heroku. Stay updated by following NeetoDeploy on Twitter and reading our blog.
One of the features that we wanted in our cloud deployment platform, NeetoDeploy was an application metrics. We decided to use Prometheus for building this feature. Prometheus is an open source monitoring and alerting toolkit and is a CNCF graduated project. Venturing into the Cloud Native ecosystem of projects apart from Kubernetes was something we had never done before. We ended up learning a lot about Prometheus and how to use it during the course of building this feature.
Initial setup
We installed Prometheus in our Kubernetes cluster by writing a deployment configuration YAML and applying it to our cluster. We also provisioned an AWS Elastic Block Store volume using a PersistentVolumeClaim to store the metrics data collected by Prometheus. Prometheus needed a configuration file where we defined what all targets it will be scraping metrics from. This is a YAML file which we stored in a ConfigMap in our cluster.
Targets in Prometheus can be anything that exposes metrics data in the
Prometheus format at a /metrics endpoint. This can be your application
servers, Kubernetes API servers or even Prometheus itself. Prometheus would
scrape the data at the defined scrape_interval and store it in the volume as
time series data. This can be queried and visualized in the Prometheus dashboard
that comes bundled in the Prometheus deployment.
We used kubectl port-forward command to test that Prometheus is working
locally. Once everything was tested and we confirmed, we exposed Prometheus with
an ingress so that we can hit its APIs with that url.
Initially we had configured the following targets:
- node_exporter from Prometheus, which would scrape the metrics of the machine the deployment is running on.
- kube-state-metrics which would listen to the Kubernetes API and store metrics of all the objects.
- Traefik for all the network-related metrics (like the number of requests etc.) since we are using Traefik as our ingress controller.
- kubernetes-nodes
- kubernetes-pods
- kubernetes-cadvisor
- kubernetes-service-endpoints
The last 4 scrape jobs would be collecting metrics from the Kubernetes REST API related to nodes, pods, containers and services respectively.
For scraping metrics from all of these targets, we had set a resource request of 500 MB of RAM and 0.5 vCPU to our Prometheus deployment.
After setting up all of this, the Prometheus deployment was running fine, and we were able to see the data from the Prometheus dashboard. Seeing this, we were satisfied and happily started hacking with PromQL, Prometheus's query language.
The CrashLoopBackOff crime scene
CrashLoopBackOff is when a Kubernetes pod is going into a loop of crashing,
restarting itself and then crashing again - and this was what was happening to
the Prometheus deployment we had created. From what we could see, the pod had
crashed, and when it gets recreated, Prometheus would initialize itself and do a
reload of the
Write Ahead Log (WAL).
The WAL is there for adding additional durability to the database. Prometheus stores the metrics it scrapes in-memory before persisting them to the database as chunks, and the WAL makes sure that the in-memory data will not be lost in the case of a crash. In our case, the Prometheus deployment was crashing and it would get recreated. It would try to load the data from WAL into memory, and then crash again before this was completed, leading to the CrashLoopBackOff state.
We tried deleting the WAL blocks manually from the volume, even though this would incur some data loss. This was able to bring the deployment back up again since WAL replay needn't be done. The deployment went into CrashLoopBackOff again after a while.
Investigating the error
The first line of approach we took was to monitor the CPU, memory, and disk usage of the deployment. The disk usage seemed to be normal. We had provisioned a 100GB volume and it wasn't anywhere near getting used up. The CPU usage also seemed normal. The memory usage, however, was suspicious.
After the pods had crashed initially, we recreated the deployment and monitored
it using kubectl's --watch flag for following all the pod updates. While doing
this we were able to see that the pods were going into CrashLoopBackOff because
they were getting OOMKilled first. The OOMKilled error in Kubernetes is when a
pod is terminated because it tries to use more memory than it is allotted in its
resource limits. We were consistently seeing the OOMKilled error so memory
must be the culprit here.
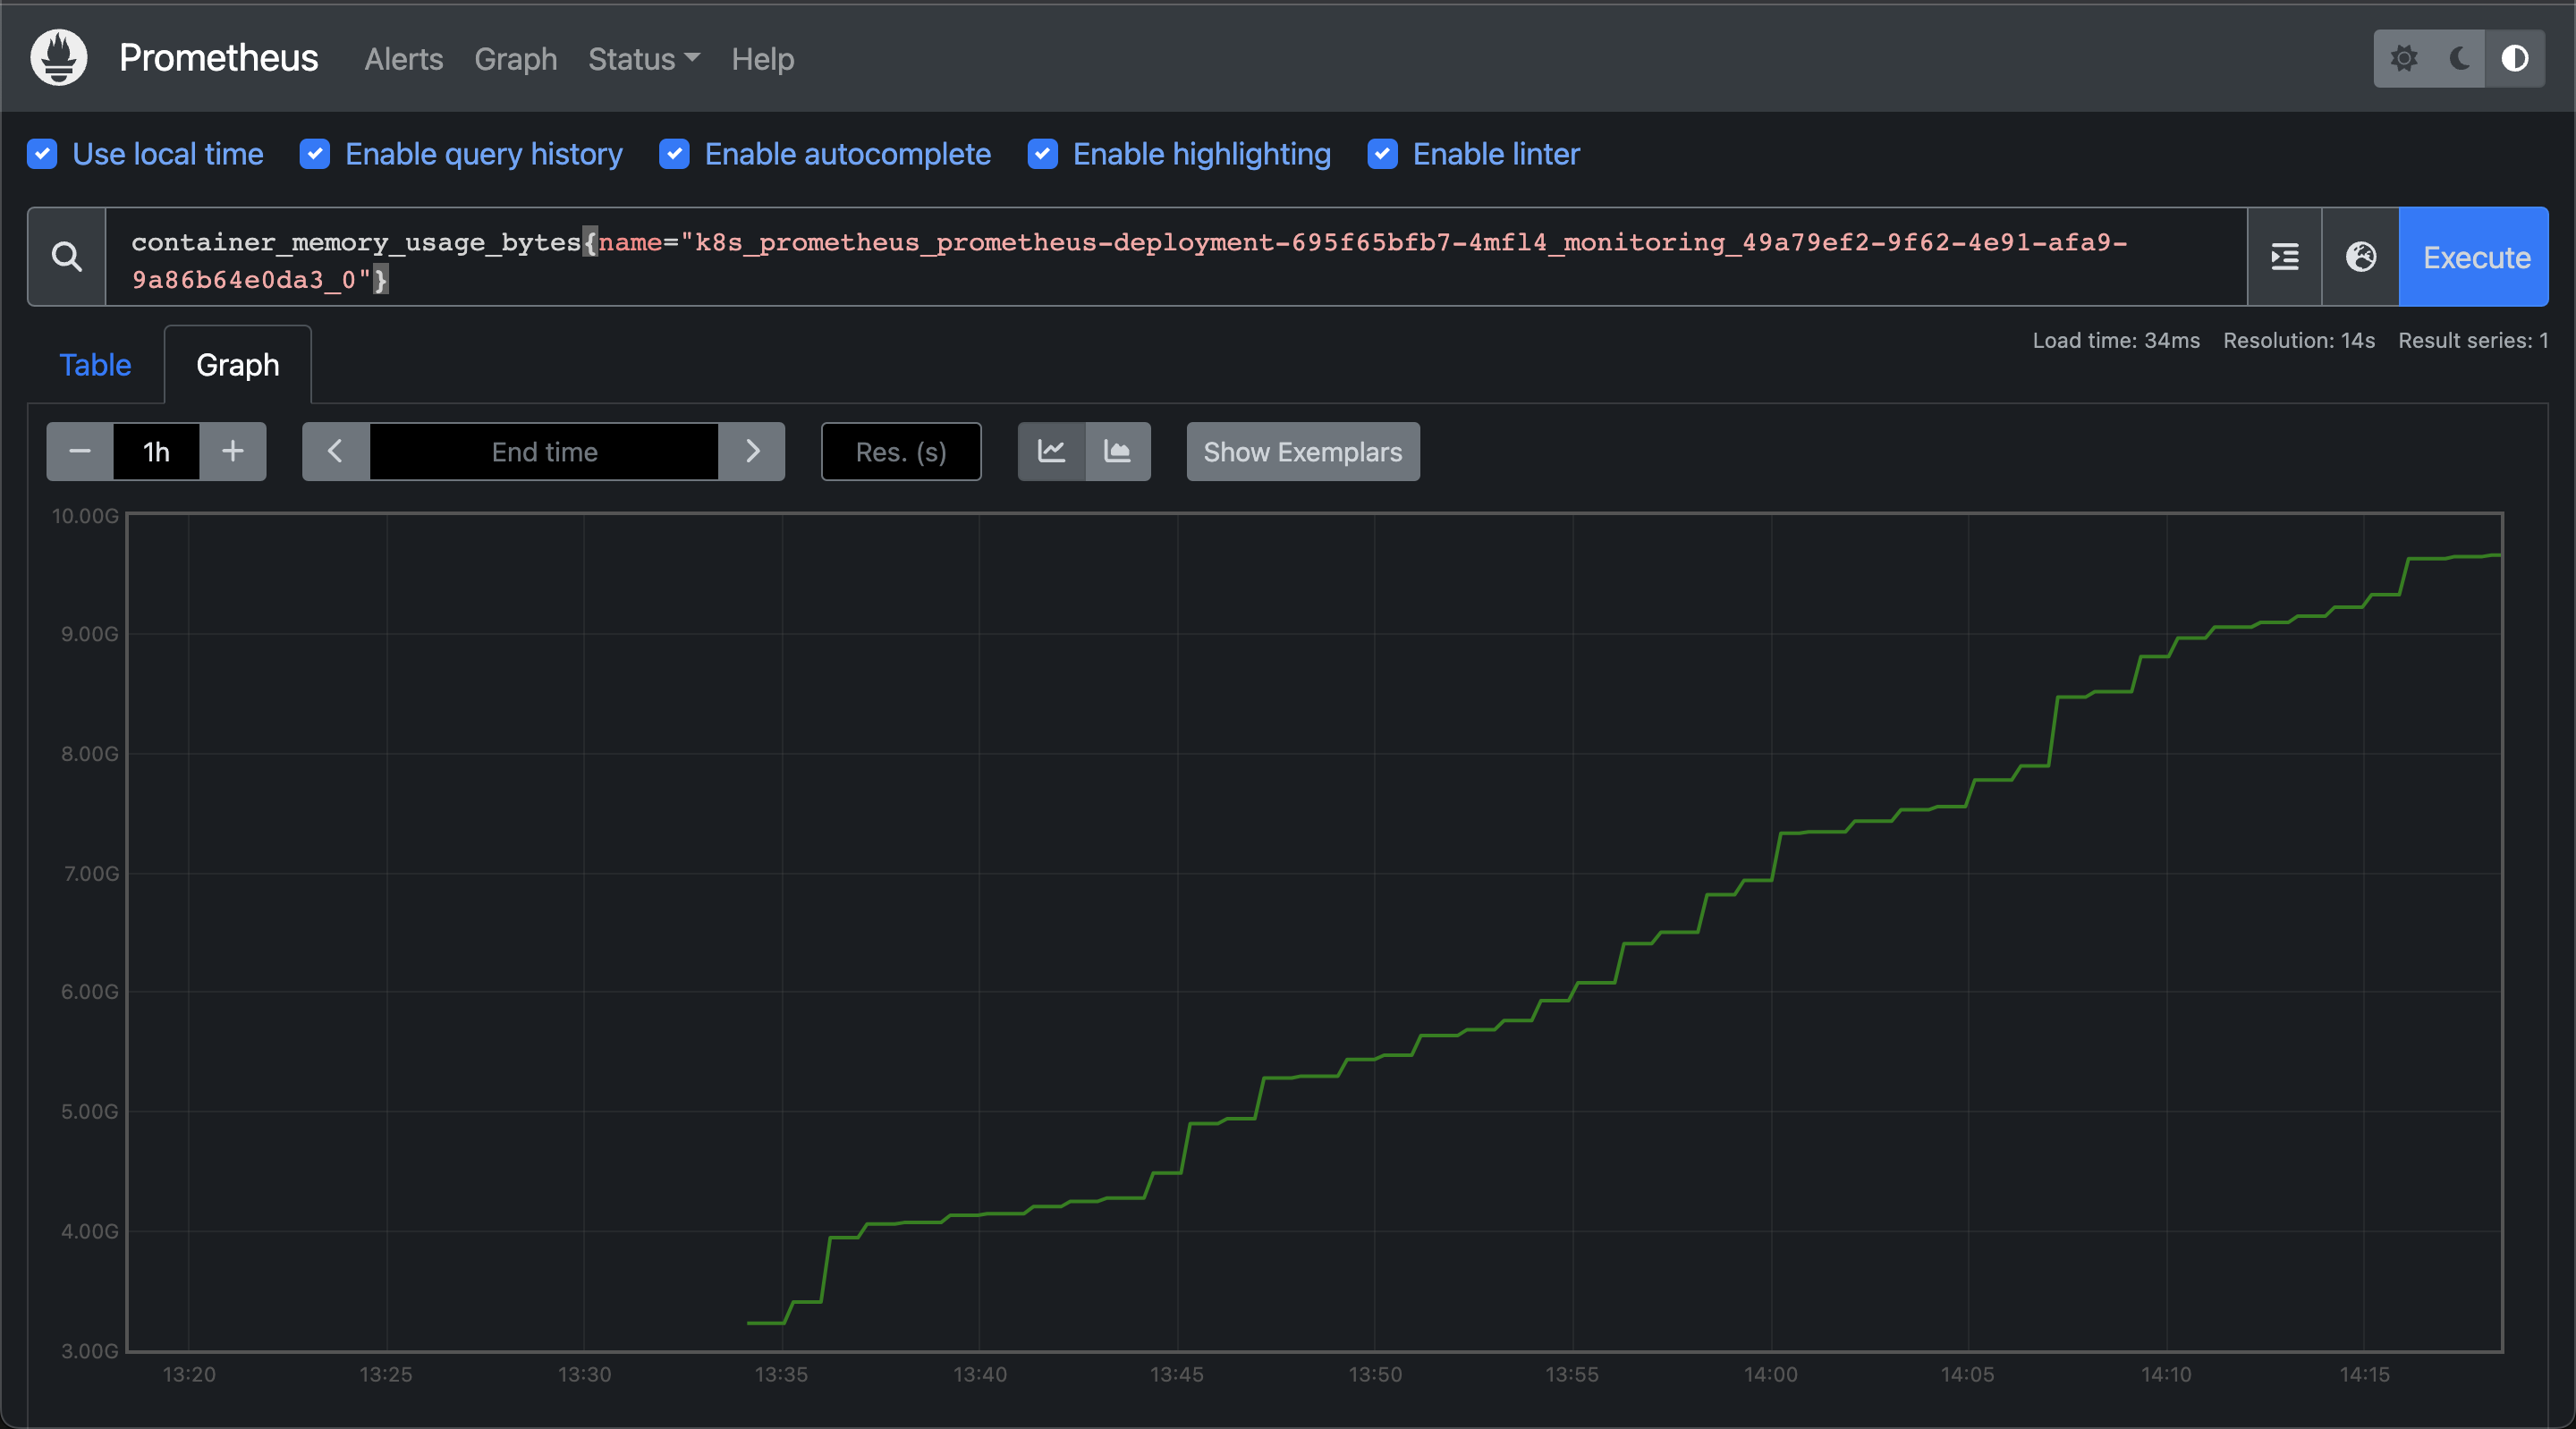
We added Prometheus itself as a target in Prometheus so that we could monitor the memory usage of the Prometheus deployment. The following was the general trend of how Prometheus's memory was increasing over time. This would go on until the memory would cross the specified limit, and then the pod would go into CrashLoopBackOff.

Now that we knew that memory was the issue, we started looking into what was causing the memory leak. After talking with some folks from the Kubernetes Slack workspace, we were asked to look at the TSDB status of the Prometheus deployment. We monitored the stats in real time and saw that the number of time series data stored in the database was growing in tens of thousands by each second! This lined up with the increase in the memory usage graph from earlier.

How we fixed it
We can calculate the memory requirement for Prometheus based on the number of targets we are scraping metrics from and the frequency at which we are scraping the data. The memory requirement of the deployment is a function of both of these parameters. In our case ,this was definitely higher than what we could afford to allocate (based on the nodegroup's machine type) since we were scraping a lot of data at a scrape interval of 15 seconds, which was set in the default configuration for Prometheus.
We increased the scrape interval to 60 seconds and removed all the targets from
the Prometheus configuration whose metrics we didn't need for building the
dashboard. Within the targets that we were scraping from, we used the
metric_relabel_configs option to persist in the database only those metrics
which we needed and to drop everything else. We only needed the
container_cpu_usage_seconds_total, container_memory_usage_bytes and the
traefik_service_requests_total metrics - so we configured Prometheus so that
only these three would be stored in our database, and by extension the WAL.
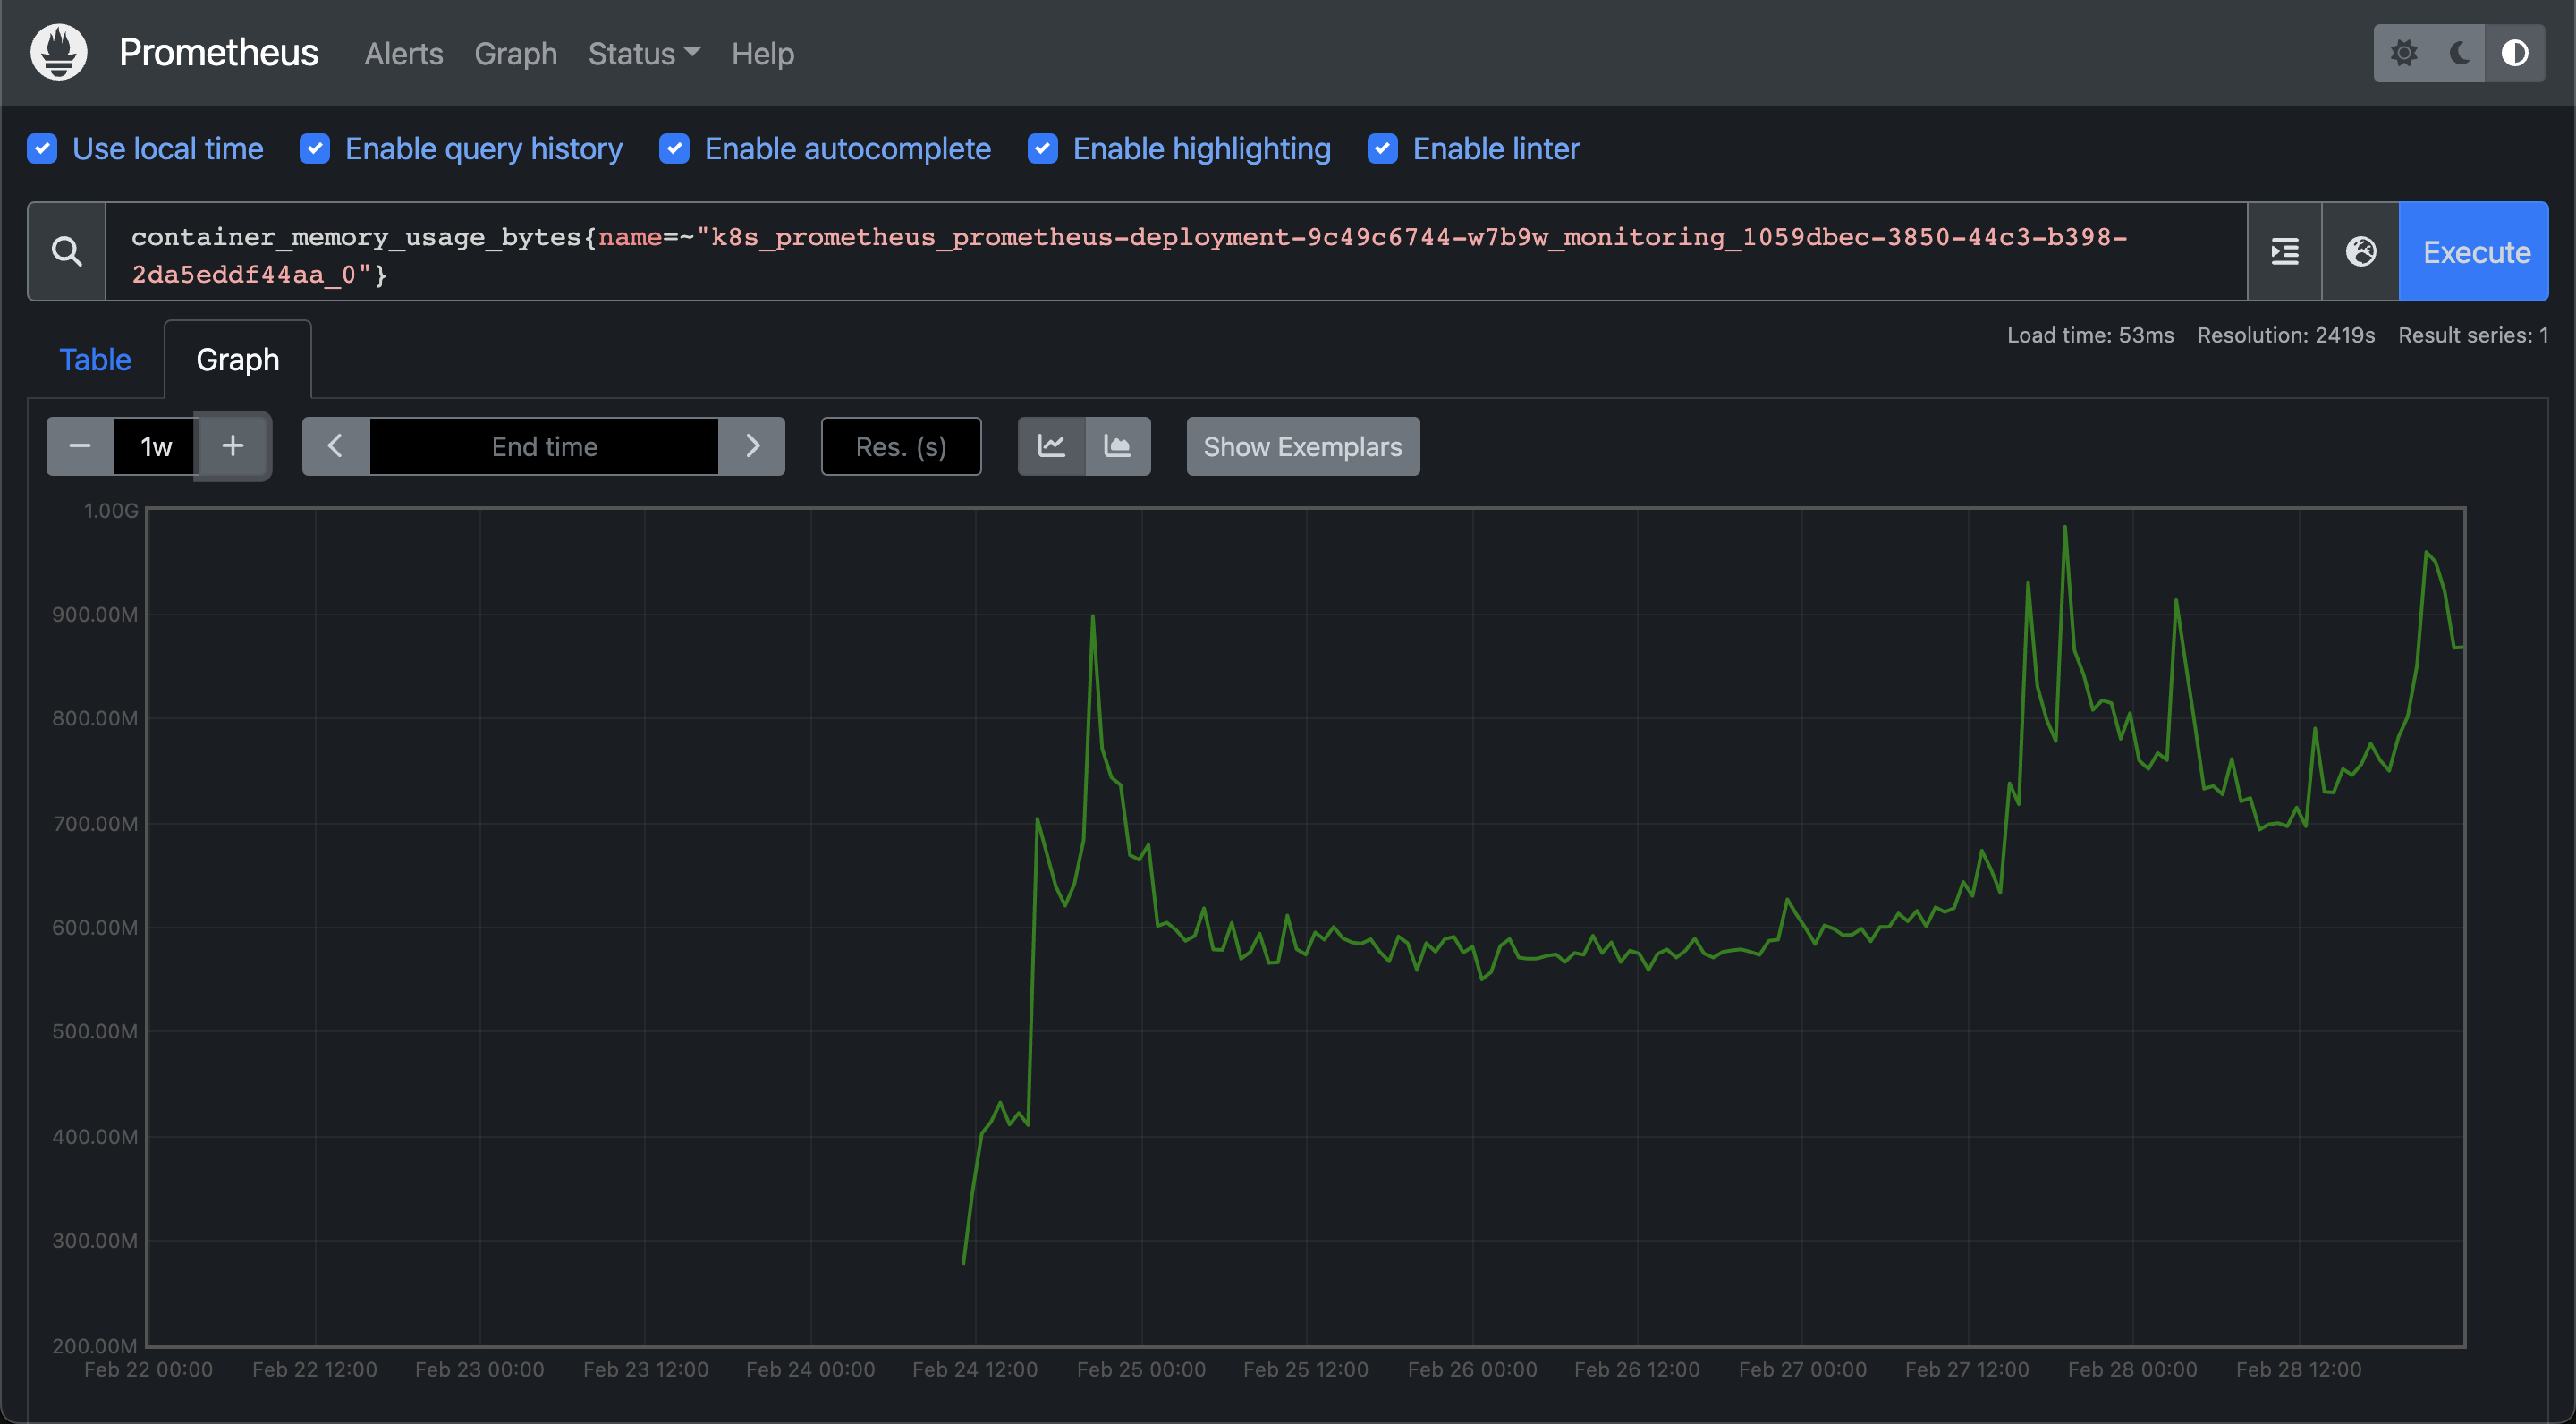
We redeployed Prometheus after making these changes and the memory showed great stability afterwards. The following is the memory usage of Prometheus over the last few days. It has not exceeded 1GB.

The aftermath
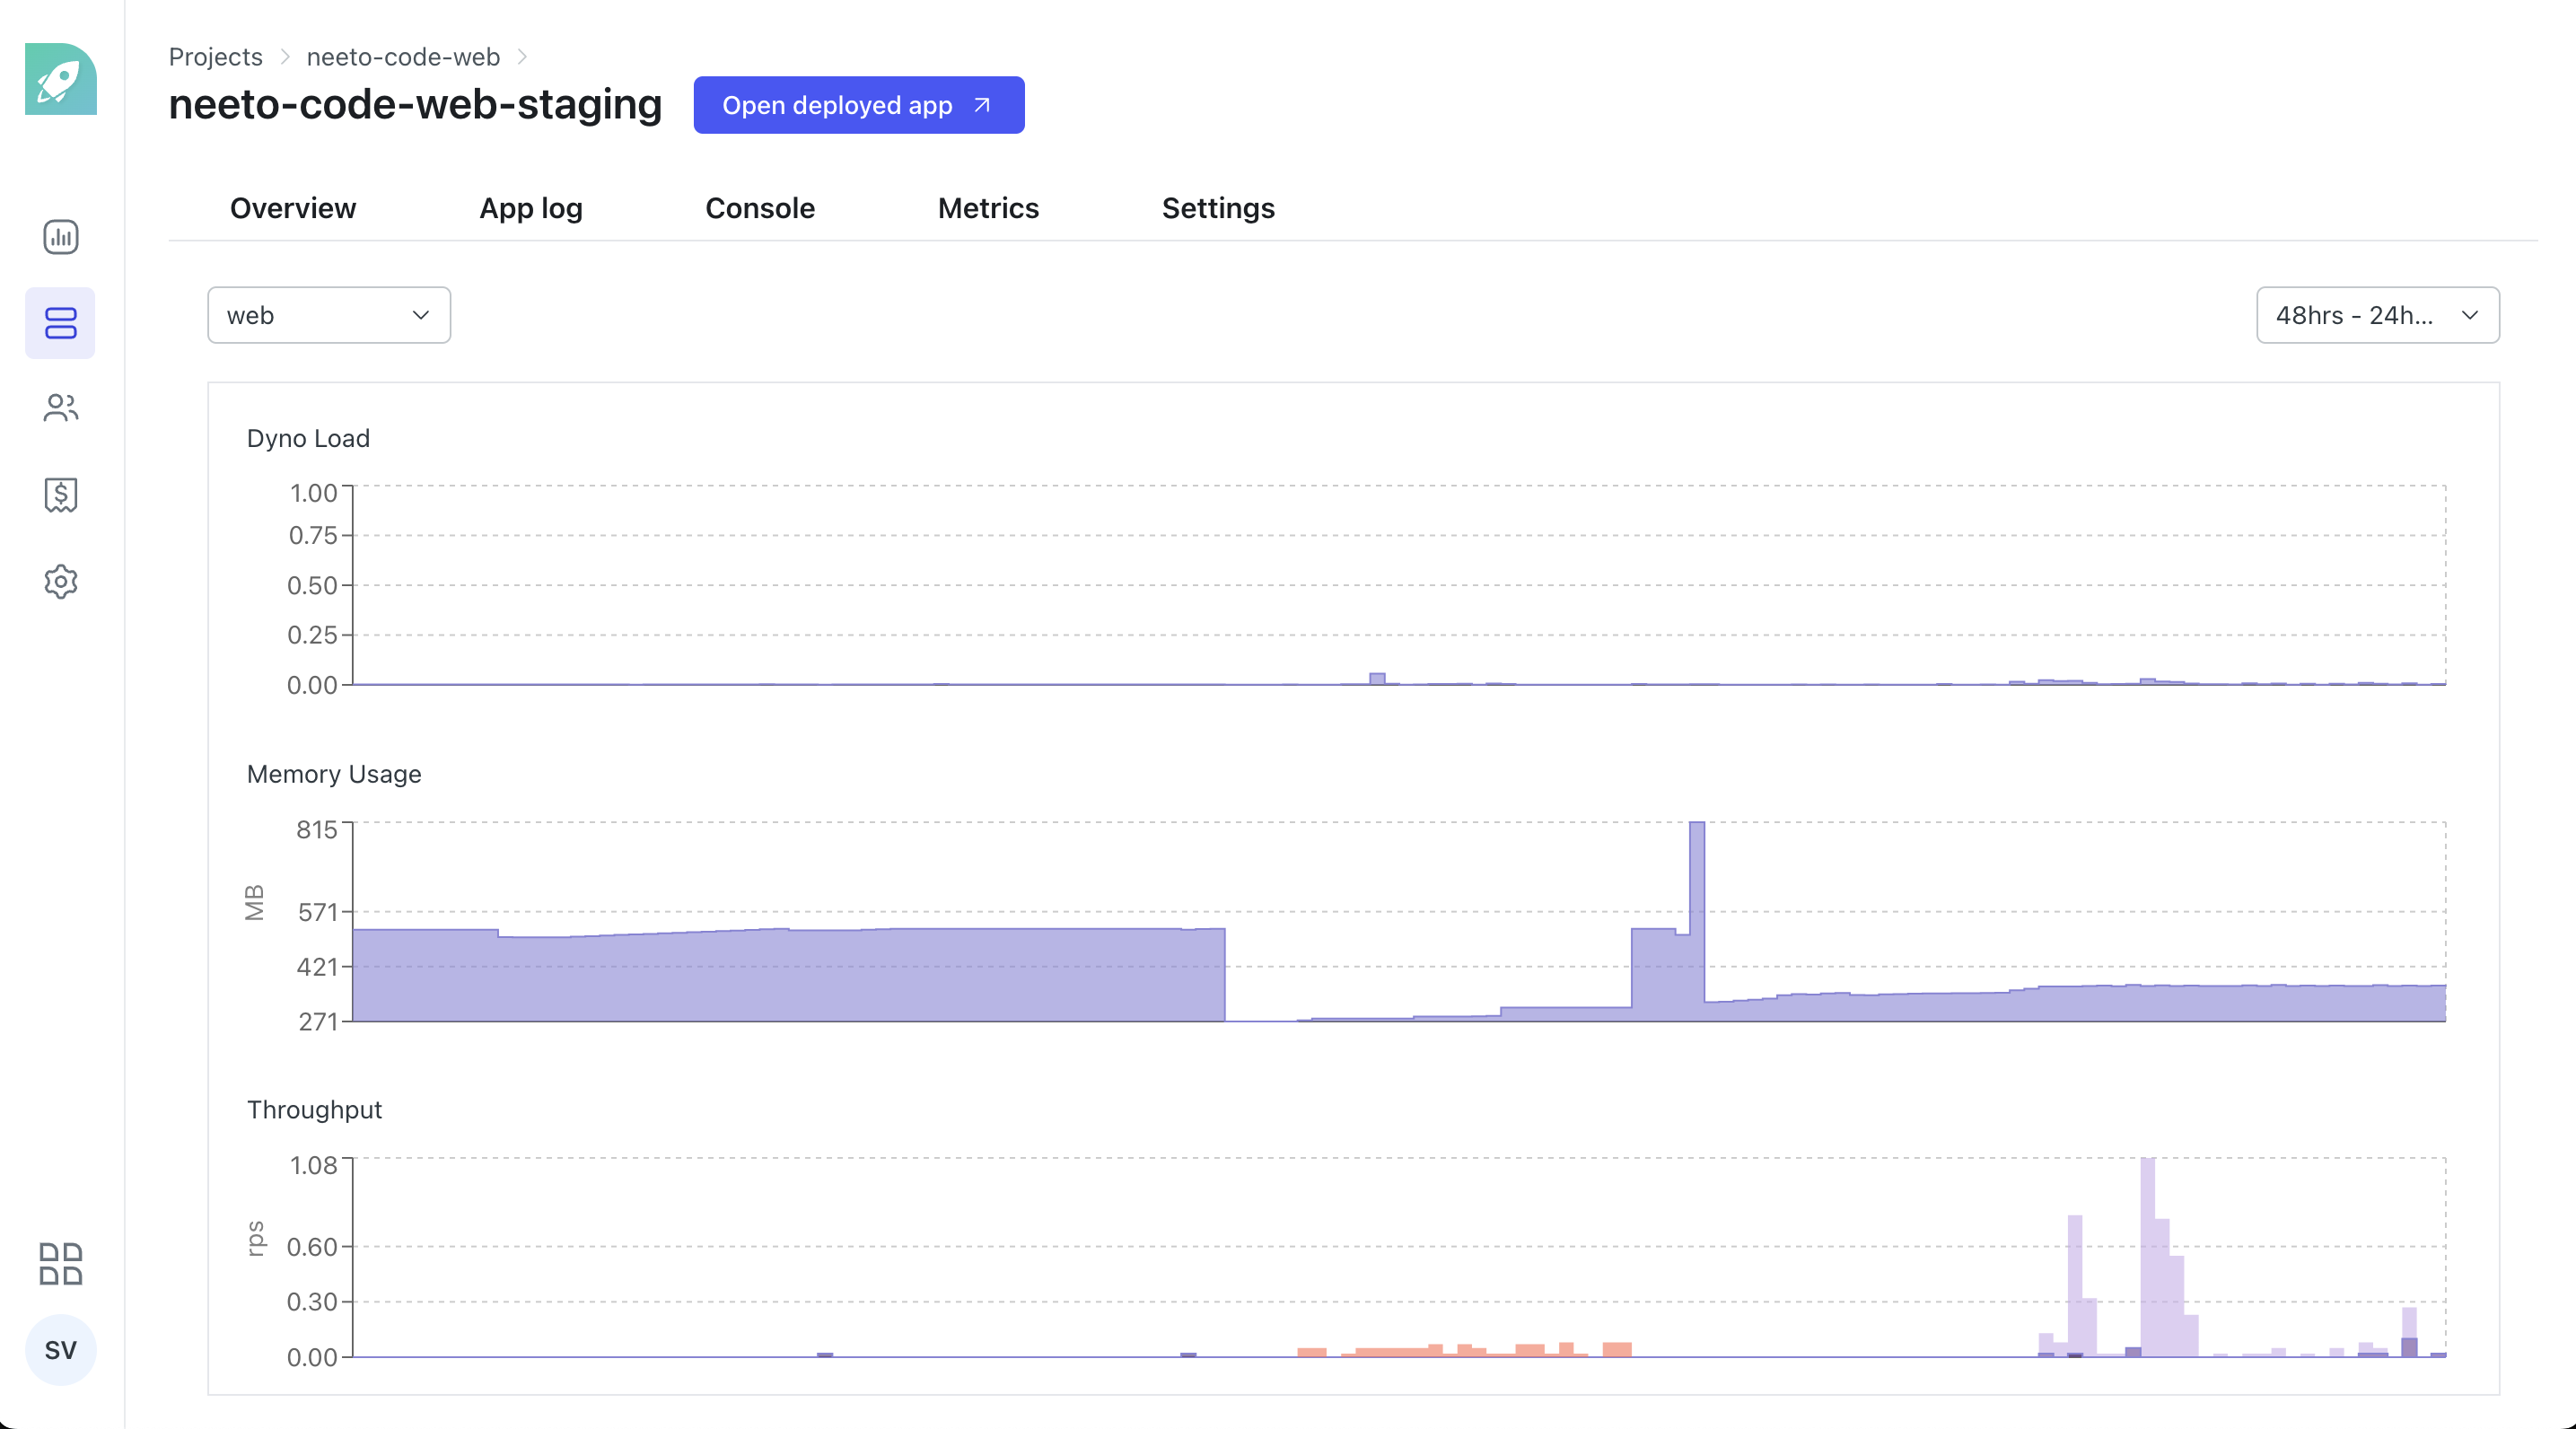
Once Prometheus was stable we were able to build the metrics dashboard with the Prometheus API in a straightforward manner. The metrics dashboard came to use within a couple of days, when the staging deployment of NeetoCode had faced a downtime. You can see the changes in the metrics from the time when the outage had occurred

The quintessential learning that we got from this experience is to always be wary of the resources that are being used up when it comes to tasks like scraping metrics over an extended period of time. We were scraping all the metrics initially in order to explore everything, even though all the metrics were not being used. But because of this, we were able to read a lot about how Prometheus works internally, and also learn some Prometheus best practices the hard way.
If your application runs on Heroku, you can deploy it on NeetoDeploy without any change. If you want to give NeetoDeploy a try, then please send us an email at [email protected].
If you have questions about NeetoDeploy or want to see the journey, follow NeetoDeploy on Twitter. You can also join our community Slack to chat with us about any Neeto product.
Follow @bigbinary on X. Check out our full blog archive.