Finding ideal number of threads per process using GVL instrumentation
May 6, 2025
This is Part 4 of our blog series on scaling Rails applications.
In part 1 we saw how to find ideal number of processes for our Rails application.
In part 3, we learned about Amdahl's law, which helps us find the ideal number of threads theoretically.
In this blog, we'll run a bunch of tests on our real production application to see what the actual number of threads should be for each process.
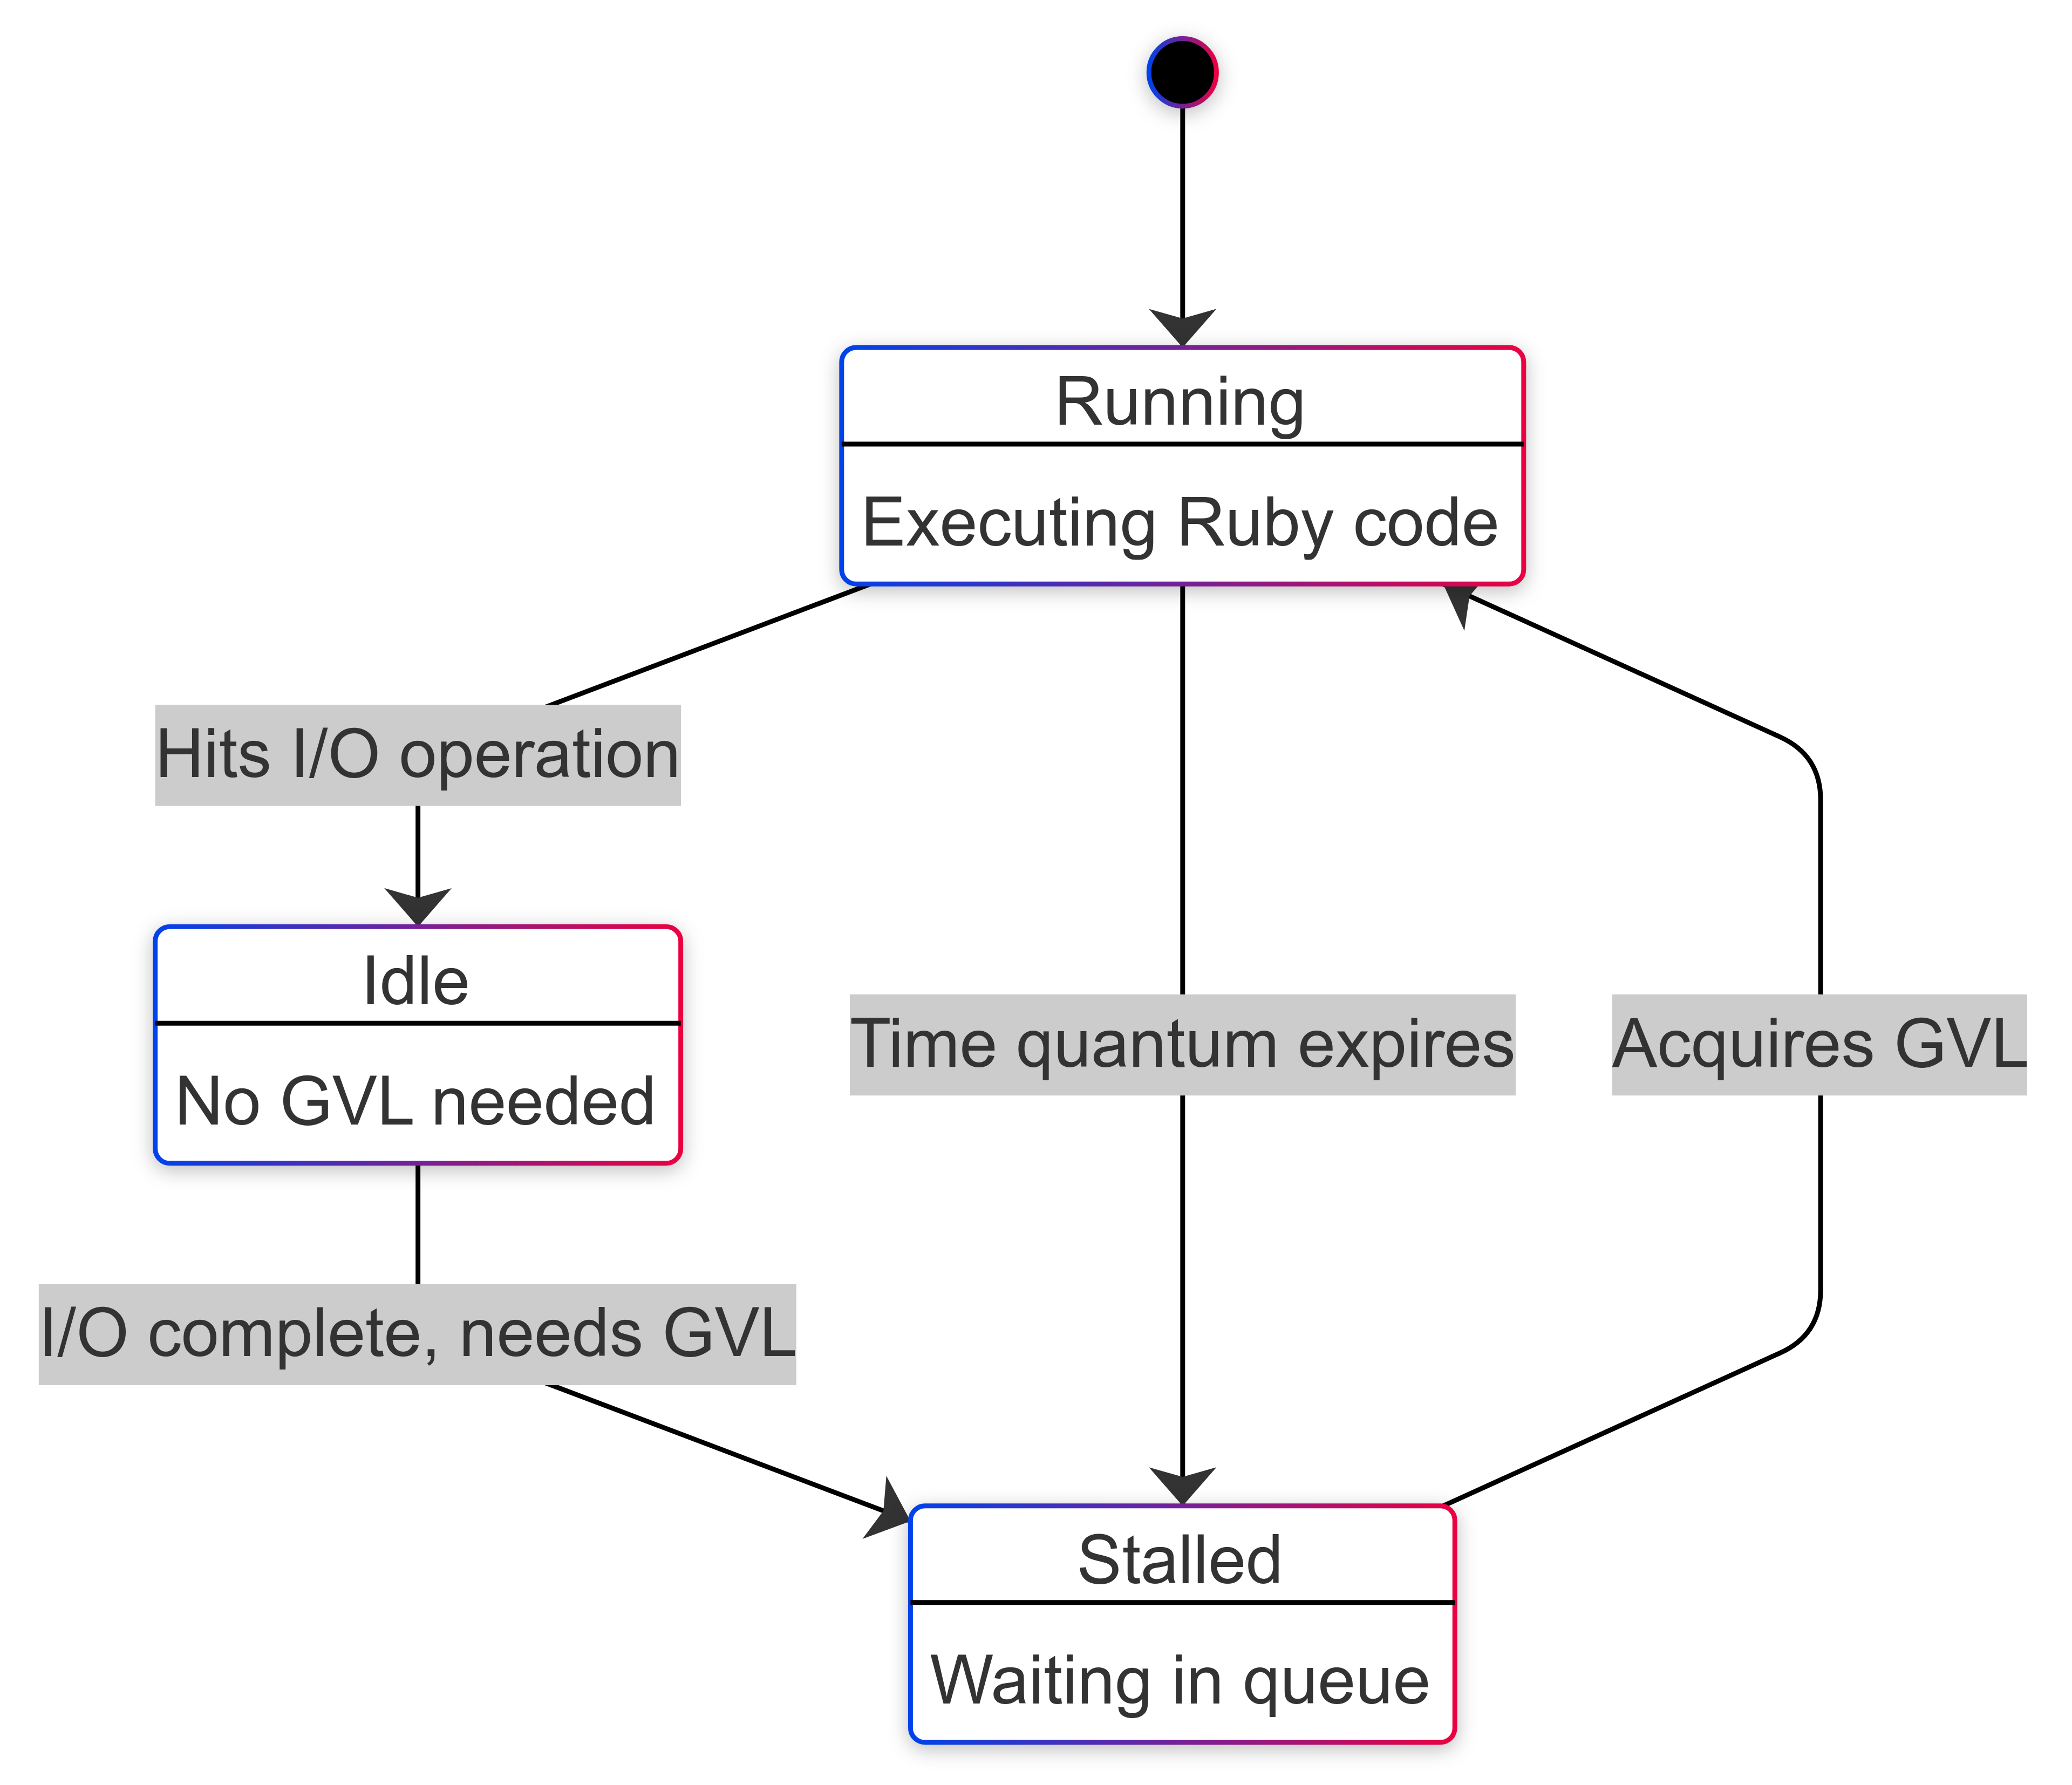
In part 1 we discussed the presence of GVL and the concept of thread switching. Based on the GVL's interaction, a thread can be in one of these three states.
- Running: The thread has the GVL and is executing Ruby code.
- Idle: The thread doesn't want the GVL because it is performing I/O operations.
- Stalled: The thread wants the GVL and is waiting for it in the GVL wait queue.

Based on the above diagram, we can approximately equate idle time to
I/O time.
GVL instrumentation using perfm
Thanks to Jean Boussier's work on the GVL instrumentation API and John Hawthorn's work on gvl_timing, we can now measure the time a thread spends in each of these states for apps running on Ruby 3.2 or higher.
Using the great work done by these folks, we have created perfm, to help us figure out the ideal number of Puma threads based on the application's workload.
Perfm inserts a Rack middleware to our Rails application. This middleware
instruments the GVL, collects the required metrics and stores them in a table.
It also has a Perfm::GvlMetricsAnalyzer class which can be used to generate a
report on the data collected.
Using perfm to measure the application's I/O percentage
To use perfm, we need to add the following line to our Gemfile.
gem 'perfm'
We'll run bin/rails generate perfm:install. This will generate the migration
to create perfm_gvl_metrics which will be used to store request-level metrics.
Now we'll create an initializer config/initializers/perfm.rb.
Perfm.configure do |config|
  config.enabled = true
  config.monitor_gvl = true
  config.storage = :local
end

Perfm.setup!
After deploying the code to production, we need to collect around 20K requests
as that will give us a fair number of data points to analyze. The GVL monitoring
can be disabled after that by setting config.monitor_gvl to false so that
the table doesn't keep growing.
After collecting the request data, now it's time to analyze it.
Run the following code in the Rails console.
irb(main):001* gvl_metrics_analyzer = Perfm::GvlMetricsAnalyzer.new(
irb(main):002*   start_time: 2.days.ago, # configure this
irb(main):003*   end_time: Time.current
irb(main):004> )
irb(main):005>
irb(main):006> results = gvl_metrics_analyzer.analyze
irb(main):007> io_percentage = results[:summary][:total_io_percentage]
=> 45.09
This will give us the percentage of time spent doing I/O. We ran it in our NeetoCal production application and we got a value of 45%.
As we discussed in
part 3,
Amdahl's law gives us a theoretical maximum speedup based on the parallelizable
portion of our workload. The formula is given below.

Where:
pis the portion that can be parallelized (in our case, it's 0.45)Nis the number of threads(1 - p)is the portion that must run sequentially (in our case, it's 0.55)
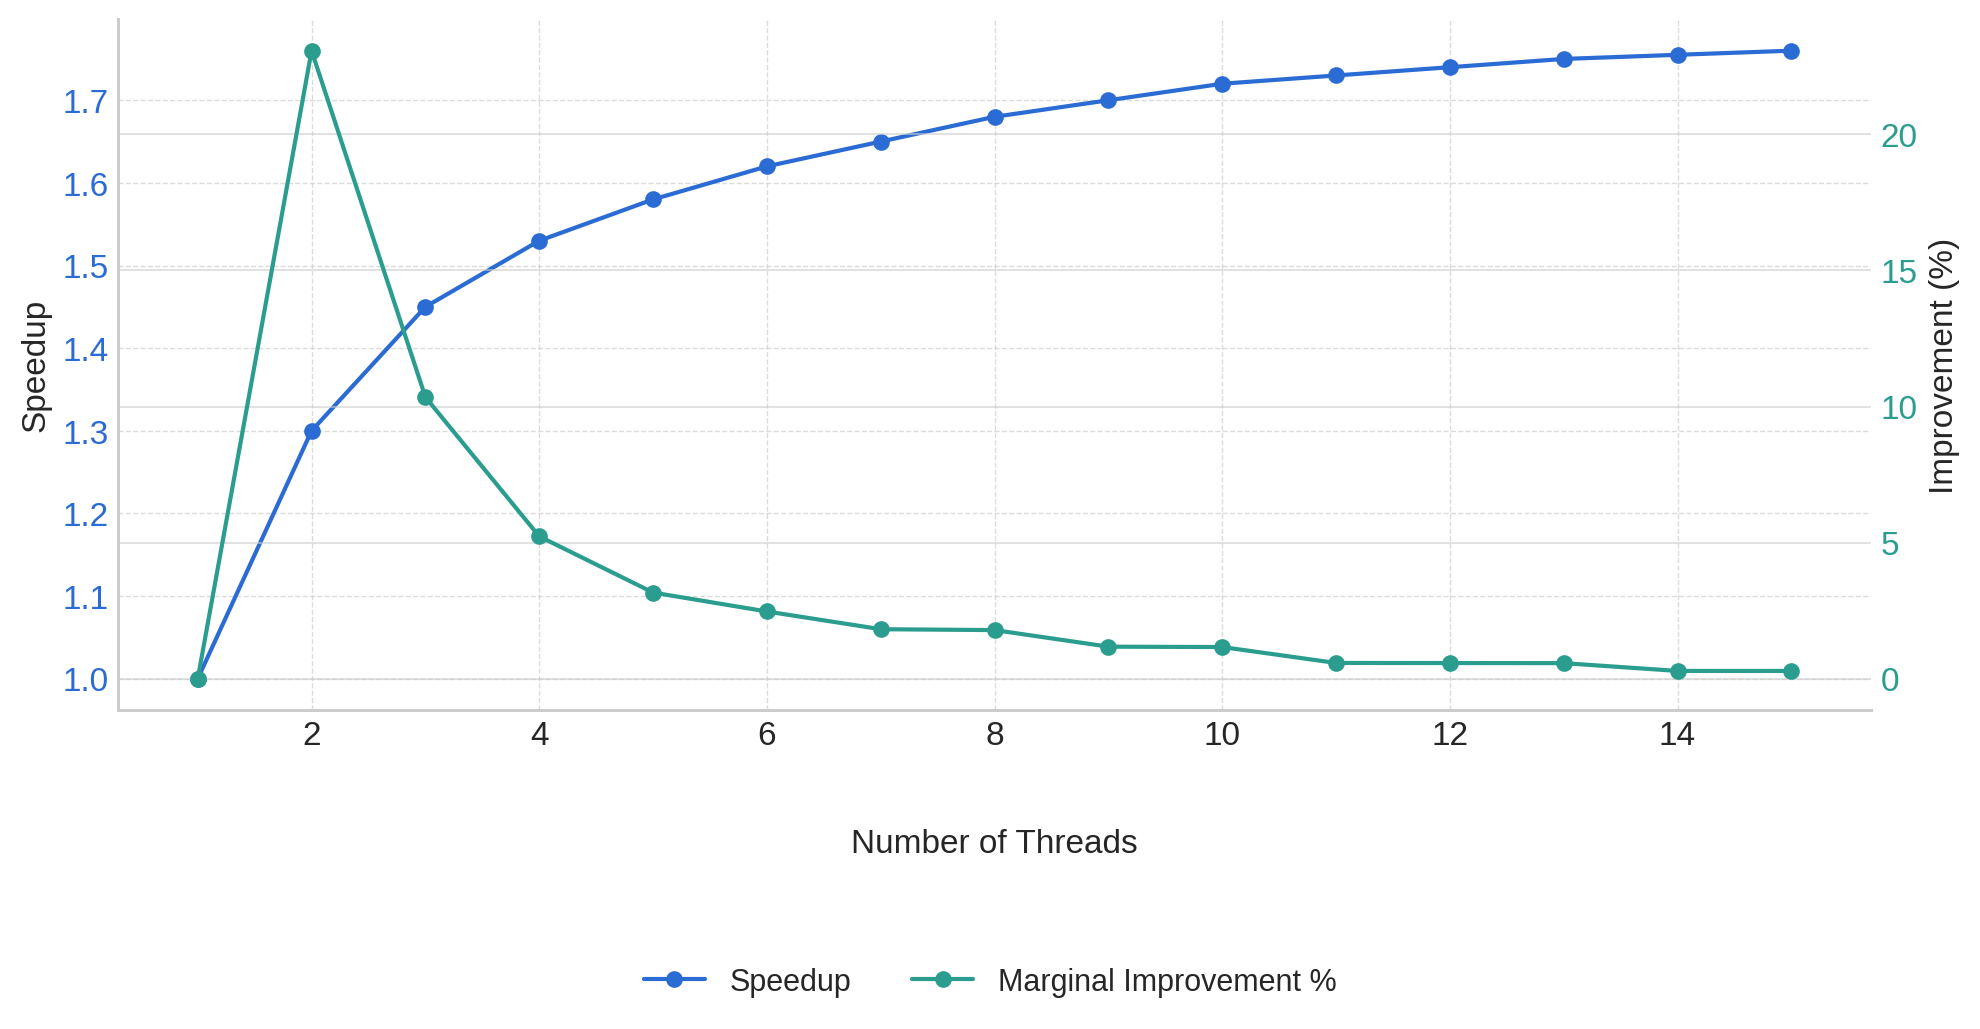
Let's calculate the theoretical speedup for different numbers of threads with p = 0.45:
| Thread Count (N) | Speedup | % Improvement from previous run |
|---|---|---|
| 1 | 1.00 | - |
| 2 | 1.29 | 29% |
| 3 | 1.43 | 11% |
| 4 | 1.52 | 6% |
| 5 | 1.57 | 3% |
| 6 | 1.60 | 2% |
| 8 | 1.64 | <2% |
| 16 | 1.69 | <1% |
| ∞ | 1.82 | - |
We can see that after 4 threads, the percentage improvement drops below 5%. This
means that 4 is a reasonable value for max_threads. We can set the value of
RAILS_MAX_THREADS to 4.

Looking at the table, adding a 5th thread would only give us a 3% performance improvement, which may not justify the additional memory usage and potential GVL contention.
We have also created a small application to help visualize and find the ideal number of threads when the I/O percentage is provided as input. Here is the link to the app.
Validate thread count using stall time
This value of 4 we got theoretically by using Amdahl's law. Now it's time to
put this law to test. Let's see in the real world if the value of 4 is the
correct value or not.
What we need to do is start with RAILS_MAX_THREADS env variable (Puma
max_threads) set to 4 and then check if this value provides minimal GVL
contention. By GVL contention, we mean the amount of time a thread spends
waiting for the GVL i.e the stall time.
If the stall time is high, that means the set thread count is high. We don't
want our request threads to spend their time doing nothing causing latency
spikes.75ms is an acceptable value for stall time. The lesser the better of
course.
The average stall time can be found in the perfm analyzer results. As we mentioned earlier, we had collected data for NeetoCal. Now let's find the average stall time.
irb(main):001* gvl_metrics_analyzer = Perfm::GvlMetricsAnalyzer.new(
irb(main):002*   start_time: 2.days.ago,
irb(main):003*   end_time: Time.current,
irb(main):004*   puma_max_threads: 4
irb(main):005> )
irb(main):006> results = gvl_metrics_analyzer.analyze
irb(main):007> avg_stall_ms = results[:summary][:average_stall_ms]
=> 110.24
The stall time seems a bit high. Let us decrease the RAILS_MAX_THREADS value
by 1 and collect a few data points(i.e around 20K requests). Now the value of
RAILS_MAX_THREADS will be 3. This process has to be repeated until we find
the value for which the average stall time is less than 75ms.
irb(main):001* gvl_metrics_analyzer = Perfm::GvlMetricsAnalyzer.new(
irb(main):002*   start_time: 2.days.ago,
irb(main):003*   end_time: Time.current,
irb(main):004*   puma_max_threads: 3
irb(main):005> )
irb(main):006> results = gvl_metrics_analyzer.analyze
irb(main):007> avg_stall_ms = results[:summary][:average_stall_ms]
=> 79.38
Now the output is closer to 75 ms.
Hence we can finalize on the value 3 as the value for RAILS_MAX_THREADS. If we
decrease the value again by one i.e set it to 2, the stall time will decrease
but we're limiting the concurrency of our application. It is a trade-off.
Remember that our goal is to maximize concurrency while minimizing GVL contention. But if our app spends a lot of time doing I/O - for instance, if we have a proxy application that makes a lot of external API calls directly from the controller, then we can switch the app server to Falcon. Falcon is tailor-made for such use cases.
Broadly speaking, one should take care of the following items to ensure that the time spent by the request doing I/O is minimal.
- Remove N+1 queries
- Remove long-running queries
- Move inline third party API calls to background job processor
- Move heavy computational stuff to background job processor
For a finely optimized Rails application, the max_threads value will be
around 3. That's why the default value of max_threads for Rails applications
is 3 now. This has been decided after a lot of discussion
here. We recommend you read the
whole discussion. It is very interesting.
This was Part 4 of our blog series on scaling Rails applications. If any part of the blog is not clear to you then please write to us at LinkedIn, Twitter or BigBinary website.
Follow @bigbinary on X. Check out our full blog archive.