Understanding Queueing Theory
June 3, 2025
This is Part 6 of our blog series on scaling Rails applications.
Queueing Systems
In web applications, not every task needs to be processed immediately. When you upload a large video file, send a bulk email campaign, or generate a complex report, these time-consuming operations are often handled in the background. This is where queueing systems like Sidekiq or Solid Queue comes into play.
Queueing theory helps us understand how these systems behave under different conditions - from quiet periods to peak load times.
Let's understand the fundamentals of queueing theory.
Basic Terminology in Queueing Theory
-
Unit of Work: This is the individual item needing service - a job.
-
Server: This is one "unit of parallel processing capacity." In queuing theory, this doesn't necessarily mean a physical server. It refers to the ability to process one unit of work at a time. For JRuby or TruffleRuby, each thread can be considered a separate "server" since they can execute in parallel. For CRuby/MRI, because of the GVL, the concept of a "server" is different. We'll discuss it later.
-
Queue Discipline: This is the rule determining which unit of work is selected next from the queue. For Sidekiq and Solid Queue, it is FCFS(First Come First Serve). If there are multiple queues, which job is selected depends on the priority of the queue.
-
Service Time: The actual time it takes to process a unit of work (how long a job takes to execute).
-
Latency/Wait Time: How long jobs spend waiting in the queue before being processed.
-
Total Time: The sum of service time and wait time. It's the complete duration from when a job is enqueued until it finishes executing.
Little's law
Little's law is a theorem in queuing theory that states that the average number of jobs in a system is equal to the average arrival rate of new jobs multiplied by the average time a job spends in the system.
L = λW
L = Average number of jobs in the system
λ = Average arrival rate of new jobs
W = Average time a job spends in the system
For example, if jobs arrive at a rate of 10 per minute (λ), and each job takes 30 seconds (W) to complete:
Average number of jobs in system = 10 jobs/minute * 0.5 minutes = 5 jobs
This helps us understand the current state of our system and that there are 5 jobs in the system on average at any given moment.
L is also called offered traffic.
Note: Little's Law assumes the arrival rate is consistent over time.
Managing Utilization
Utilization measures how busy our processing capacity is.
Mathematically, it is the ratio of how much processing capacity we're using to the processing capacity we have.
utilization = (average number of jobs in the system/capacity to handle jobs) * 100
In other words, it could be written as follows.
utilization = (offered_traffic / parallelism) * 100
For example, if we are using Sidekiq to manage our background jobs then in a single-threaded case, parallelism is equal to the number of Sidekiq processes.
Let's look at a practical case with numbers:
- We have 30 jobs arriving every minute
- It takes 0.5 minutes to process a job
- We have 20 Sidekiq processes
In this case, the utilization will be:
utilization = ((30 jobs/minute * 0.5 minutes) / 20 processes) * 100 = 75%
High utilization is bad for performance
Let's assume we maintain 100% utilization in our system. It means that if, on average, we get 30 jobs per minute, then we have just enough capacity to handle 30 jobs per minute.
One day, we started getting 45 jobs per minute. Since utilization is at 100%, there is no extra room to accommodate the additional load. This leads to higher latency.
Hence, having a high utilization rate may result in low performance, as it can lead to higher latency for specific jobs.
The knee curve
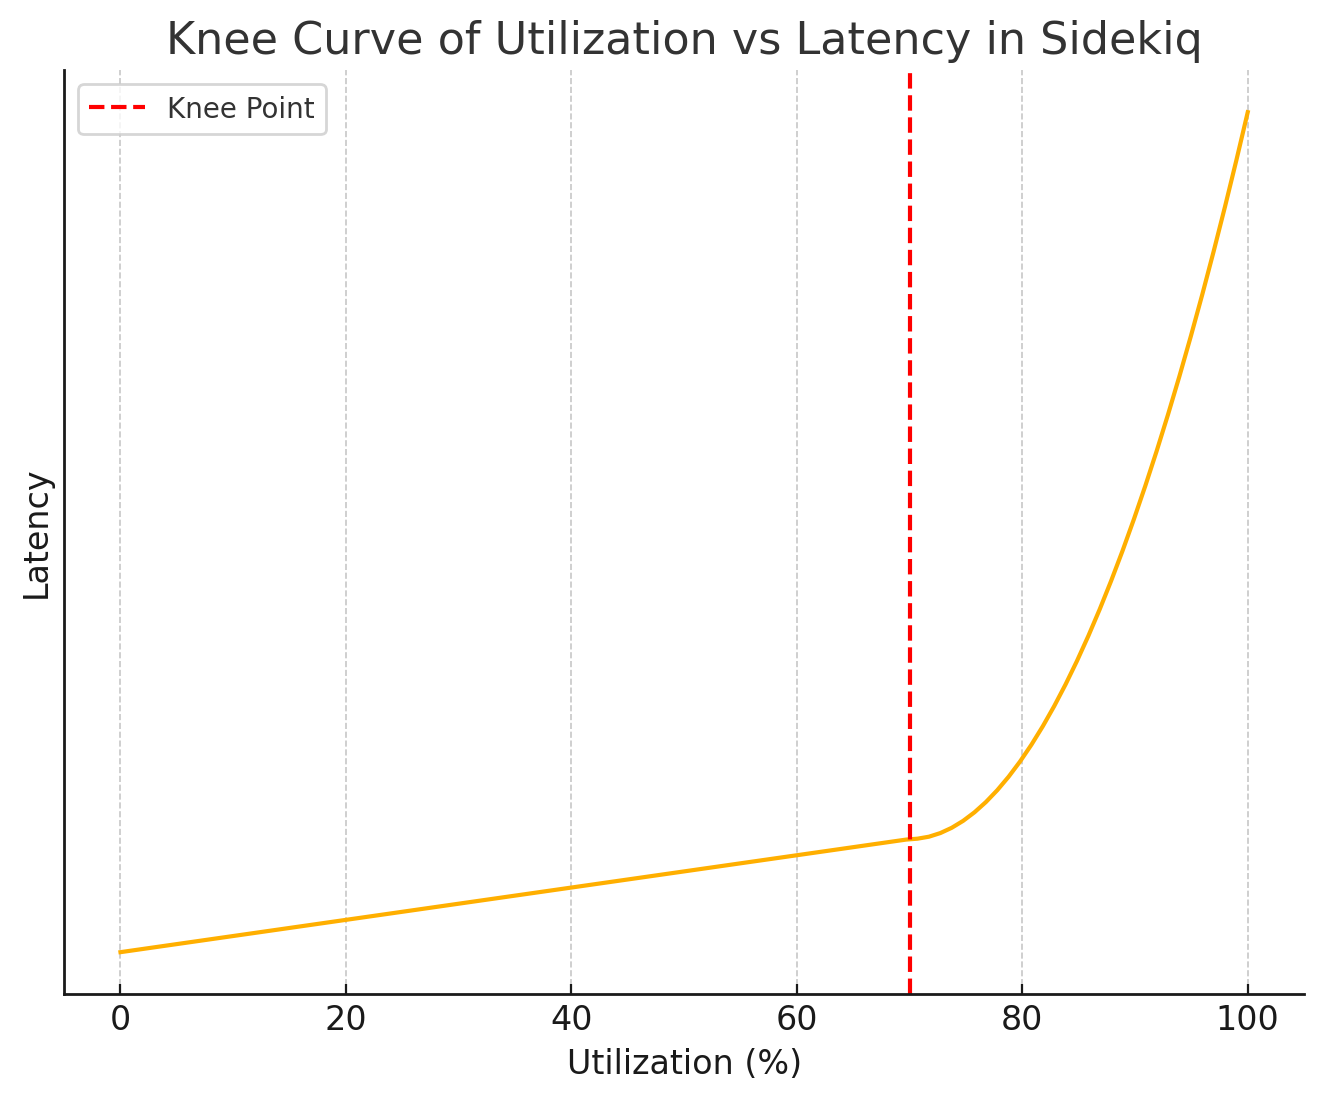
Mathematically, it would seem that only when the utilization rate hits 100% should the latency spike up. However, in the real world, it has been found that latency begins to increase dramatically when utilization reaches around 70-75%.
If we draw a graph between utilization and performance then the graph would look something like this.

The point at which the curve bends sharply upwards is called "Knee" in the performance curve. At this point, the exponential effects predicted by queueing theory become pronounced, causing the queue latency to climb up quickly.
Running any system consistently above 70-75% utilization significantly increases the risk of spiking the latency, as jobs spend more and more time waiting.
This would directly impact the customer experience, as it could result in delays in sending emails or making calls to Twilio to send SMS messages, etc.
Tracking this latency will be covered in the upcoming blogs. The tracking of metrics depends on the queueing backend used (Sidekiq or Solid Queue).
Concurrency and theoretical parallelism
In Sidekiq, a process is the primary unit of parallelism. However, concurrency (threads per process) significantly impacts a process's effective throughput. Because of GVL we need to take into account how long the job is waiting for I/O.
The more time a job spends waiting on external resources (like databases or APIs) rather than executing Ruby code, the more other threads within the same process can run Ruby code while the first thread waits.
We learned about Amdahl's law in Part 3 of this series.

Where:
p is the portion that can be parallelized (the I/O percentage)
n is the number of threads (concurrency)
Speedup is equivalent to theoretical parallelism in this context. In queueing theory, parallelism refers to how many units of work can be processed simultaneously. When we calculate speedup using Amdahl's Law, we're essentially determining how much faster a multi-threaded system can handle work compared to a single-threaded system.
Let's assume that a system has an I/O of 50% and a concurrency of 10. Then Speedup will be:
Speedup = 1 / ((1 - 0.5) + 0.5 / 10) = 1 / 0.55 = 1.82 ≈ 2
This means one Sidekiq process with 10 threads will handle jobs twice as fast as Sidekiq with a single process with a single thread.
Let's recap what we are saying here. We are assuming that the system has I/O of 50%. System is using a single Sidekiq process with 10 threads(concurrency). Then because of 10 threads the system has a speed gain of 2x compared to system having just a single thread. In other words, just because we have 10 threads running we are not going to gain 10X performance improvement. What those 10 threads is getting us is what is called "theoretical parallelism".
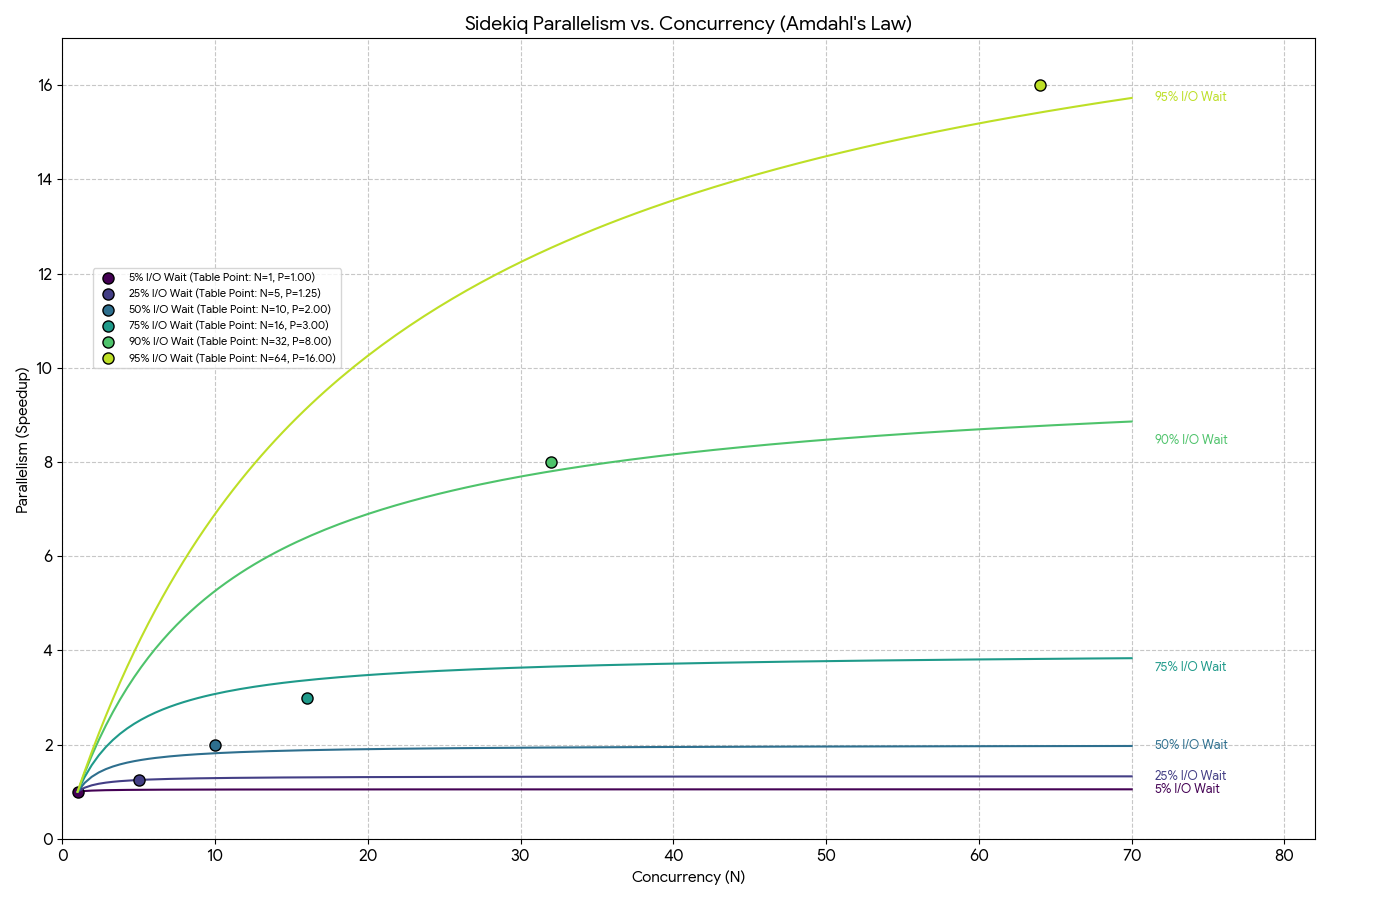
Similarly, for other values of I/O and Concurrency, we can get the theoretical parallelism.
| I/O | Concurrency | Theoretical parallelism |
|---|---|---|
| 5% | 1 | 1 |
| 25% | 5 | 1.25 |
| 50% | 10 | 2 |
| 75% | 16 | 3 |
| 90% | 32 | 8 |
| 95% | 64 | 16 |
Let's go over one more time. In the last example, what we are stating is that if a system has 95% I/O and if the system has 64 threads running, then that will give 16x performance improvement over the same system running on a single thread.
Here is the graph for this data.

As shown in the graph, a Sidekiq process with 16 threads handling jobs that are 75% I/O-bound achieves a theoretical parallelism of approximately 3. In other words, 3x performance improvement is there over a single-threaded system.
Calculating the number of processes required
At the beginning of this article, we discussed "Little's law" and we discussed
that L is also called "offered traffic," which depicts the "average number of
jobs in the system".
If "offered traffic" is 5, then it means we have 5 units of work arriving on average that requires processing simultaneously.
We just learned that if the utilization is greater than 75% then it can cause problems as there is a risk of latency to spike.
For queues with low latency requirements(eg. urgent), we need to target a
lower utilization rate. Let's say we want utilization to be around 50% to be on
the safe side.
Now we know the utilization rate that we need to target and we know the "offered traffic". So now we can calculate the "parallelism".
utilization = offered_traffic / parallelism
=> 0.50 = 5 / parallelism
=> parallelism = 5 / 0.50 = 10
This means we need a theoretical parallelism of 10 to ensure that the utilization is 50% at max.
Let's assume the jobs in this queue have an average of 50% I/O. Based on the
above mentioned graph, we can see that if the concurrency is 10 then we get
parallelism of 2. However, increasing the concurrency doesn't increase the
parallelism. It means if we want 10 parallelism, then we can't just switch to
concurrency of 50. Even the concurrency of 50 (or 50 threads) will only yield a
parallelism of 2.
So we have no choice but to add more processes. Since one process with 10 concurrency is yielding a parallelism of 2 we need to add 5 processes to get 10 parallelism.
To get the I/O wait percentage, we can make use of perfm. Here is the documentation on how it can be done.
Total number of Sidekiq processes required = 10 / 2 = 5
Here we're talking about Sidekiq free version, where we'll only be able to run a single process per dyno. If we're using Sidekiq Pro, we can run multiple processes per dyno via Sidekiq Swarm.
We can provision 5 dynos for the urgent queue. But we should always have a queue time based autoscaler like Judoscale enabled to handle spikes.
Sources of Saturation
We discussed earlier that, in the context of queueing theory, the saturation point is typically reached at around 70-75% utilization. This is from the point of view of further gains by adding more threads.
However saturation can occur in other parts of the system.
CPU
The servers running your Sidekiq processes have finite CPU and memory. While CPU usage is a metric we can track for Sidekiq, it's generally not the only one we need to focus on for scaling decisions.
CPU utilization can be misleading. If our jobs spend most of their time doing I/O (like making API calls or database queries), in which case CPU usage will be very low, even when our Sidekiq system is at capacity.
Memory
Memory utilization impacts performance very differently from CPU utilization. Memory utilization generally exhibits minimal changes in latency or throughput from 0% to 100% utilization. However, after 100% utilization, things will start to deteriorate significantly. The system will start using the swap memory, which can be very slow and thereby increase the job service times.
Redis
Another place where saturation can occur is in our datastore i.e Redis in case
of Sidekiq. We have to make sure that we provision a separate Redis instance for
Sidekiq and also make sure to set the eviction policy to noeviction. This
ensures that Redis will reject new data when the memory limit is reached,
resulting in an explicit failure rather than silently dropping important jobs.
This was Part 6 of our blog series on scaling Rails applications. If any part of the blog is not clear to you then please write to us at LinkedIn, Twitter or BigBinary website.
Follow @bigbinary on X. Check out our full blog archive.