How to analyze Playwright traces

January 15, 2026
Playwright traces are like flight recorders for your tests - they capture every action, network request, DOM snapshot, and console log during test execution. When a test fails, especially in CI environments, traces become the most powerful debugging tool, providing a complete timeline of what happened and why.
We learned so much about Playwright traces while adding the Playwright's tracing capabilities to NeetoPlaydash. We built NeetoPlaydash and it is the most affordable Playwright Dashboard. NeetoPlaydash collects, monitors and debugs Playwright test reports.
What are Playwright traces?
Playwright traces are compressed archives (.zip files) that contain:
- Complete DOM snapshots before, during, and after each action.
- Screenshots of the browser state at every step.
- Network activity, including all HTTP requests and responses.
- Console logs from both the browser and your test.
- Action timeline showing what your test did and when.
- Source code mapping actions back to your test files.
- Metadata about the test environment, browser, and configuration.
Think of traces as a time machine for test execution - we can pause at any moment and see exactly what the browser looked like, what network calls were in flight, and what our code was doing.
What is the Trace Viewer?
The Trace Viewer is an application used to view and analyze the information collected in trace files. Traces are information collected into a zip file during test execution. The Trace Viewer makes sense of and displays this information in an interactive interface.
We can view traces in two ways:
- Locally - Using the Trace Viewer app that ships with Playwright (via the Playwright CLI).
- Online - By visiting trace.playwright.dev and uploading our trace file.
Both methods provide the same powerful debugging experience, allowing us to navigate through our test execution, inspect DOM snapshots, analyze network requests, and debug failures.
Understanding the Trace Viewer interface
One can download a sample trace file to follow along with this blog. We can also view it directly in the Trace Viewer.
The Trace Viewer interface is divided into several key areas that work together to help us debug your tests.
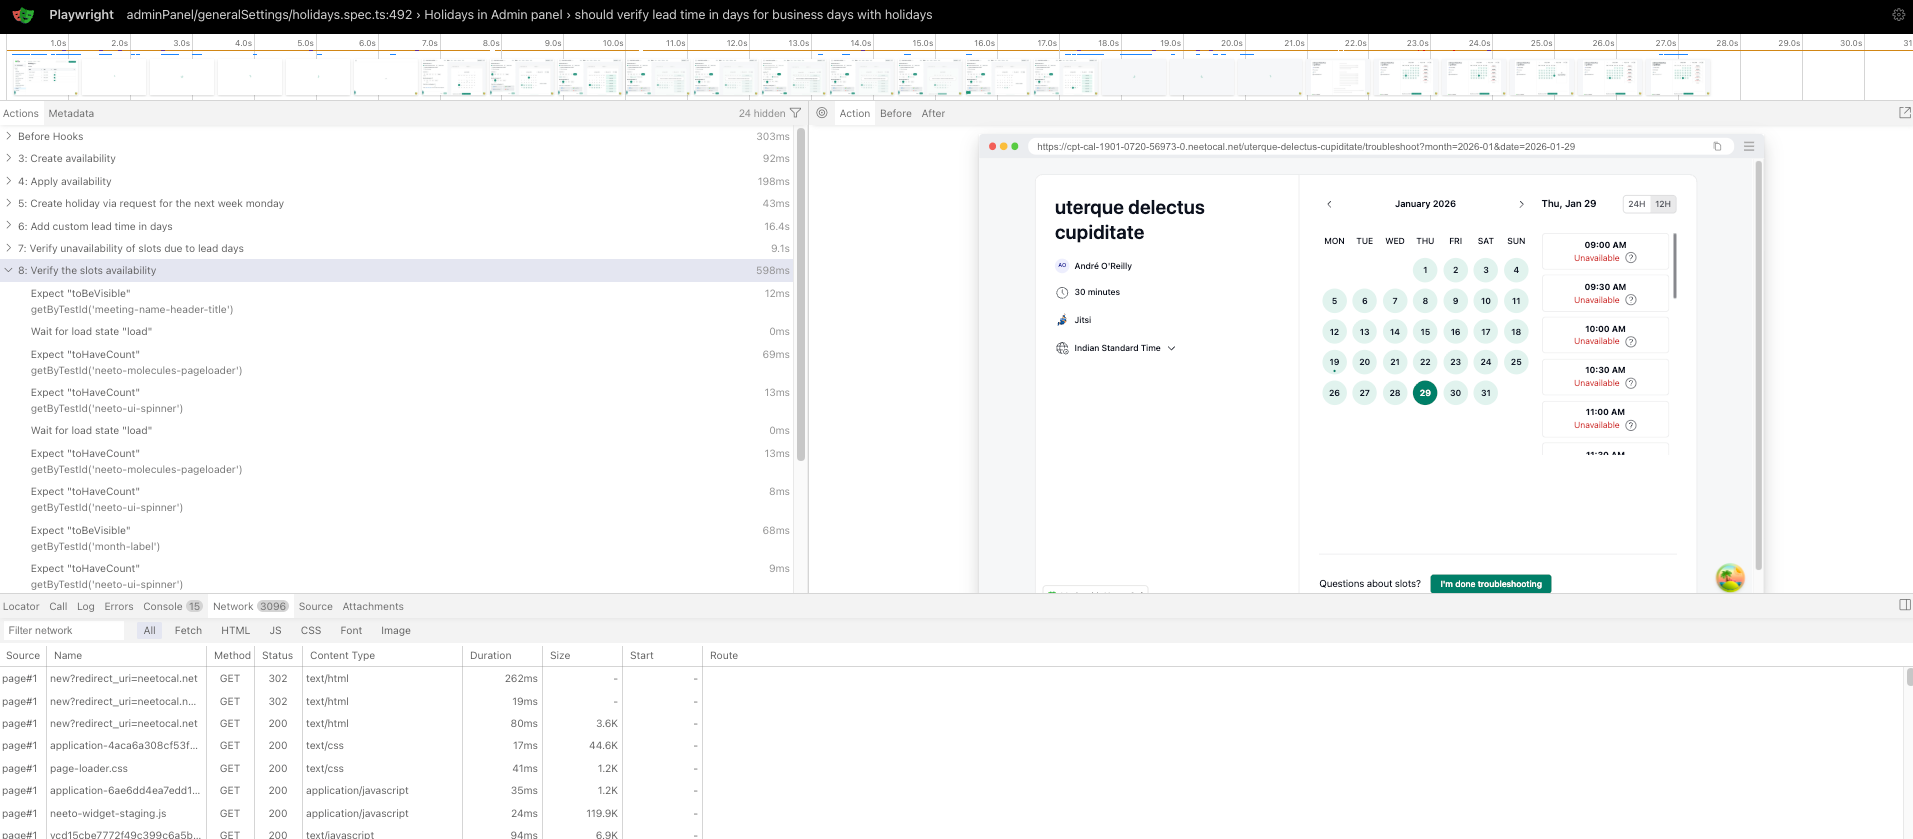
1. Action Timeline (Top)
A visual filmstrip showing screenshots of our test execution over time. We can:
- Hover to see magnified previews.
- Click to jump to specific moments.
- Double-click an action to focus on its time range.
- Drag to select a range of actions for filtering.
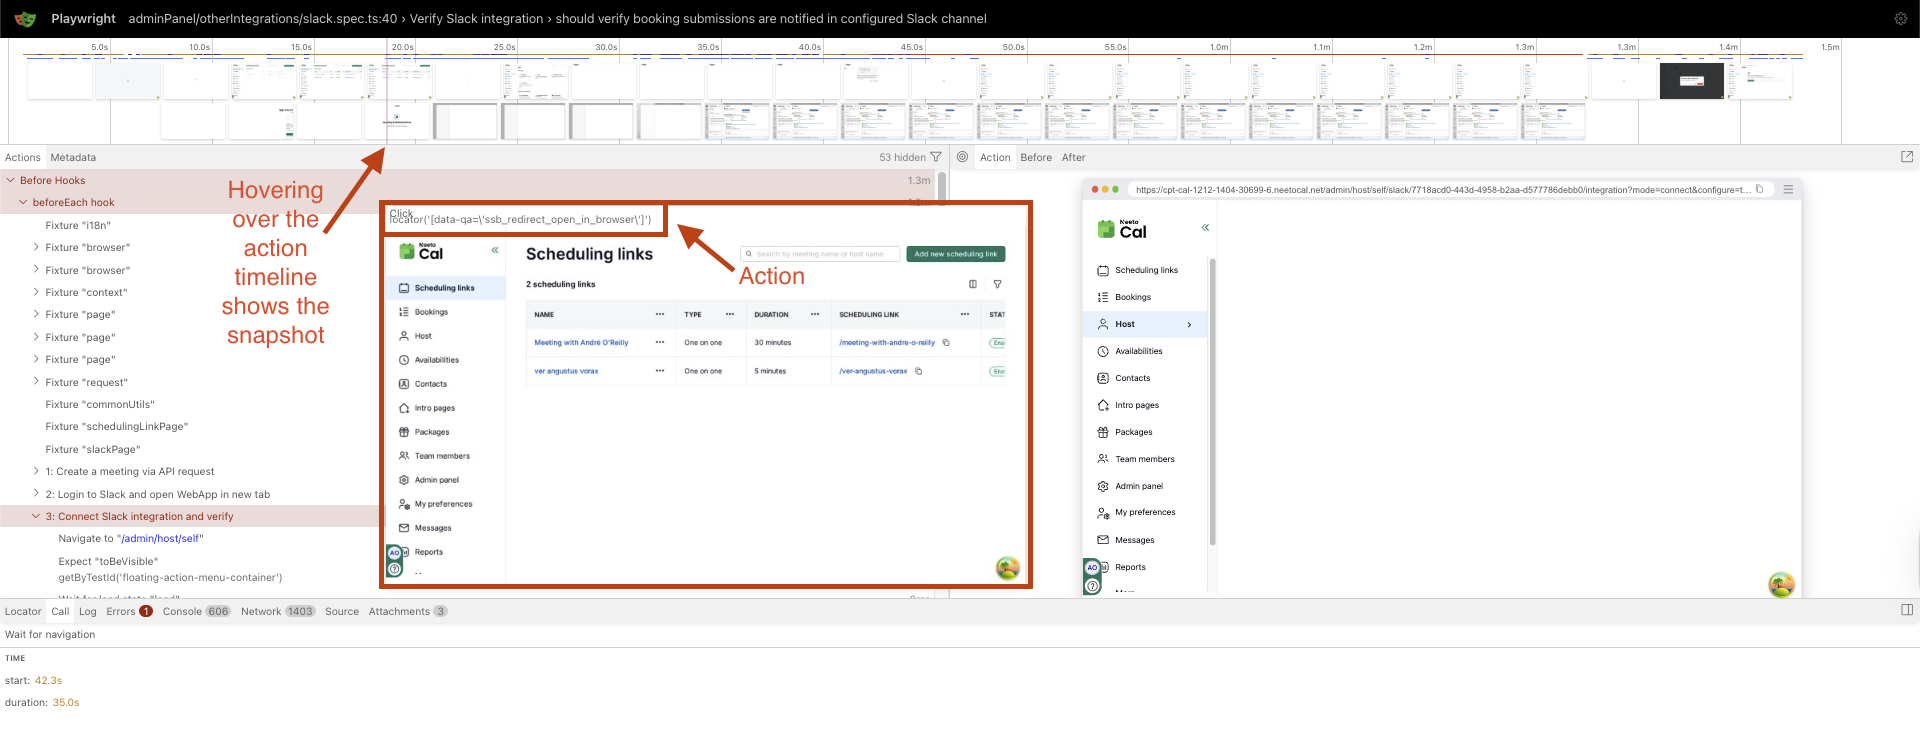
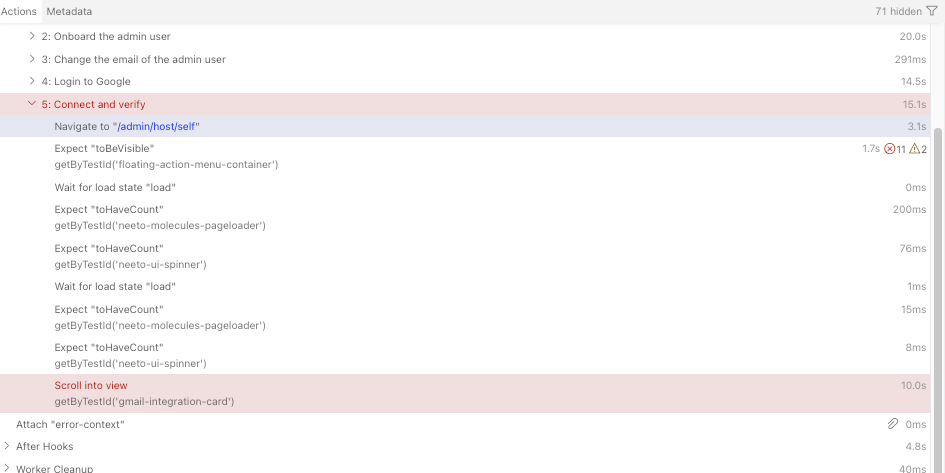
2. The Actions Tab: Our test execution timeline
The Actions tab is typically our starting point. Each action shows:
- Duration anomalies - Actions taking unusually long suggest performance issues or waiting problems.
- Locator information - Verify that we are targeting the correct elements.
- Action sequence - Ensure actions execute in the expected order.
- Red/failed actions - These are our primary debugging targets.
Hover over each action to see the DOM highlight change in real-time. This helps verify that Playwright is interacting with the correct element.
Example:
✓ page.goto("https://app.neetocal.com") - 1.2s
✓ page.getByTestId("login-button").click() - 0.3s
✗ page.getByTestId("email-input").fill("[email protected]") - 30s TIMEOUT
Here, the fill action timed out. Select the action and use the Before and After tabs above the main snapshot viewing area to see why the element wasn't available.
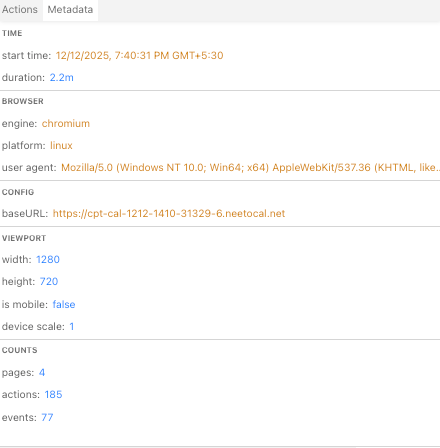
3. Metadata Tab: Environment context
The Metadata section provides high-level contextual information about the test execution environment and run characteristics. This information helps in understanding when, how, and under what conditions the trace was recorded.
- Time: Displays the start time, end time, and total duration of the test.
- Browser: Displays the browser (e.g., Chromium, Firefox, WebKit), platform, and user agent used during the test run.
- Config: Shows the Playwright configuration applied for the run. Includes relevant settings such as test options, retries, timeouts, and project-level overrides.
- Viewport: Specifies the viewport dimensions used during execution. Helps diagnose layout, responsiveness, and visual issues tied to screen size.
- Counts (Metrics): Summarizes key execution metrics captured in the trace,
such as:
- Pages - Pages captured during the trace.
- Actions - Actions performed during the test.
- Events - Runtime events logged during execution.
This is particularly useful when:
- Tests pass locally but fail in CI.
- Tests behave differently across browsers.
- Issues are viewport-specific (responsive design bugs).
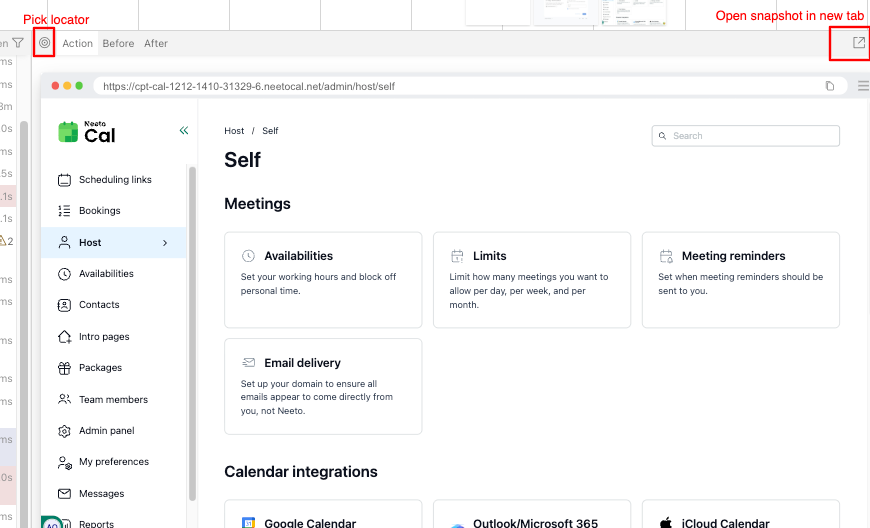
4. Main Content Area (Center)
The Main Content Area is the primary visual workspace of the Trace Viewer. It displays detailed, interactive views of the application state for the selected action, enabling precise inspection and debugging.
Pick Locator
Allows us to interactively select elements directly from the snapshot. Automatically generates the corresponding Playwright locator, helping validate selectors and improve test reliability.
Snapshots: Time-Travel Debugging
Snapshots capture the complete DOM state at three critical moments:
- Action - The exact moment of interaction (showing the precise click coordinates or input position with a red dot).
- Before - State when the action was called.
- After - State after the action is completed.
Using snapshots effectively:
- Compare Before/After to see what changed.
- Inspect element visibility - Was the element actually visible and interactable?
- Check for overlays - Are modals, loading spinners, or other elements blocking interaction?
- Verify element state - Is the button disabled? Is the input read-only?
Debugging technique: When a click fails, examine the highlighted click position in the Action snapshot. If it's not where we expect, we may have:
- Multiple elements matching your locator (strict mode violation).
- An element that moved during Playwright's auto-wait.
- An element obscured by another element (z-index issues).
Open Snapshot in a New Tab
Opens the current DOM snapshot in a separate browser tab. Useful for deep inspection, side-by-side comparison, or analyzing complex layouts without losing trace context.
5. Tab Bar (Bottom/Right)
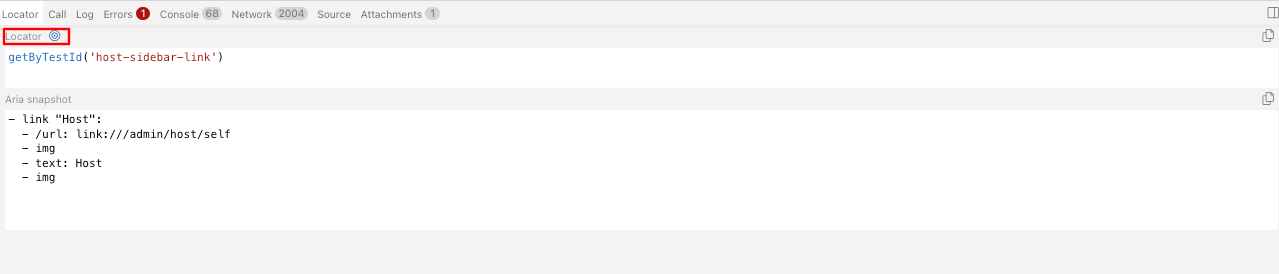
Locator Tab
This is useful to get the locator of any element. Click the Locator button and hover over any component in the snapshot; the locator for that element will appear in the code space below the button. The reverse is also possible - typing a locator in the code space will highlight the corresponding element in the main content area, making it easy to verify locators and test selectors.
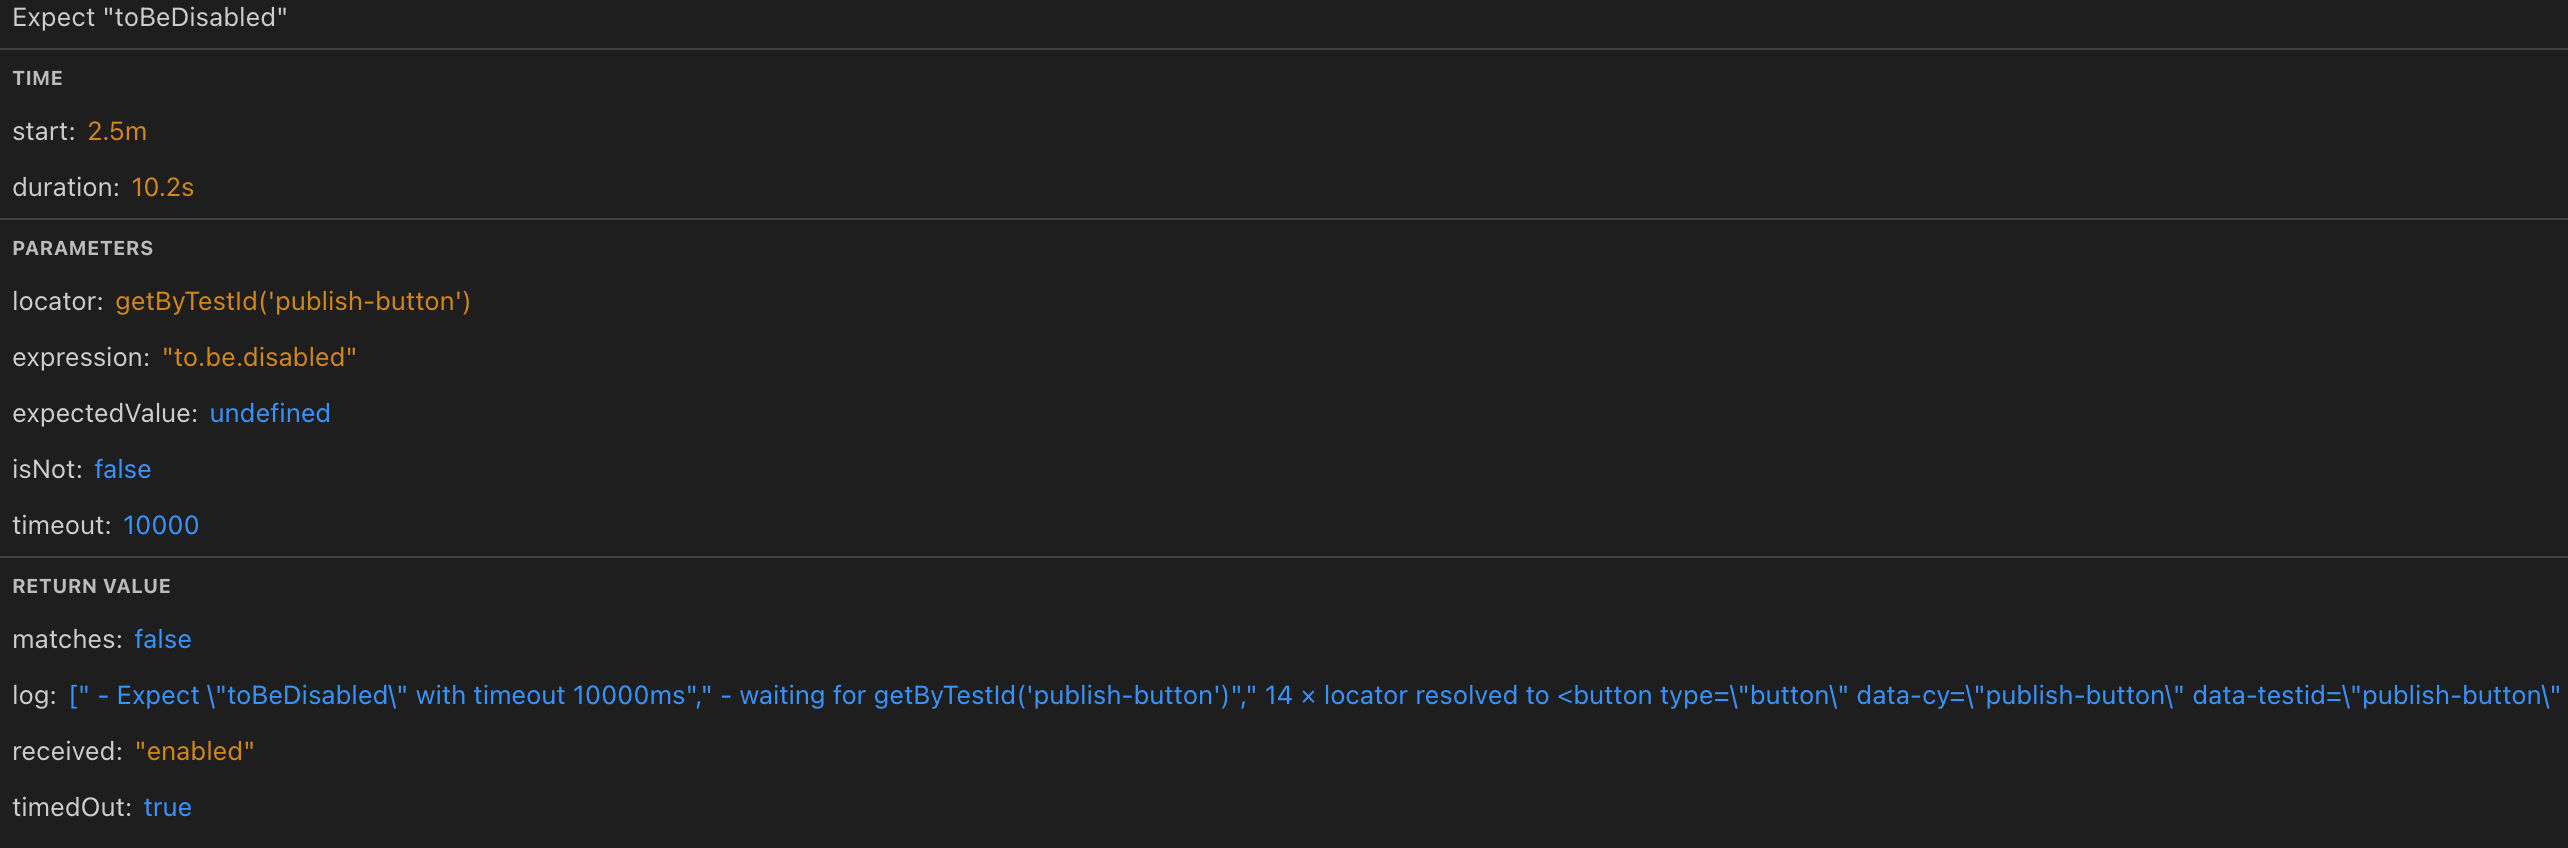
Call Tab: Action details
The Call tab provides granular information about each action:
- Function signature - The exact Playwright method called.
- Parameters - Arguments passed to the function.
- Locator string - How Playwright found the element.
- Strict mode - Whether strict mode was enforced.
- Timeout - Maximum wait time configured.
- Return value - The resolved value of the Playwright function call.
Example:
await expect(page.getByTestId("publish-btn")).toBeDisabled({ timeout: 10_000 });
The corresponding details would show the function signature, parameters, and execution result.
Log Tab: Playwright's internal actions
The Log tab reveals what Playwright does behind the scenes. Contains Playwright-generated internal logs for the selected action. Provides insight into retries, waiting behavior, timeouts, and internal decision-making.
→ waiting for getByTestId('submit-button').
→ locator resolved to <button>Submit</button>.
→ scrolling element into view if needed.
→ waiting for element to be visible.
→ waiting for element to be enabled.
→ waiting for element to be stable.
→ waiting for element to receive pointer events.
→ performing click action.
✓ click action completed.
Why this matters: Understanding Playwright's auto-wait mechanism helps us in following areas:
- Identify which wait condition failed.
- Optimize your locators.
- Add appropriate waits when auto-wait isn't sufficient.
- Debug flaky tests caused by race conditions.
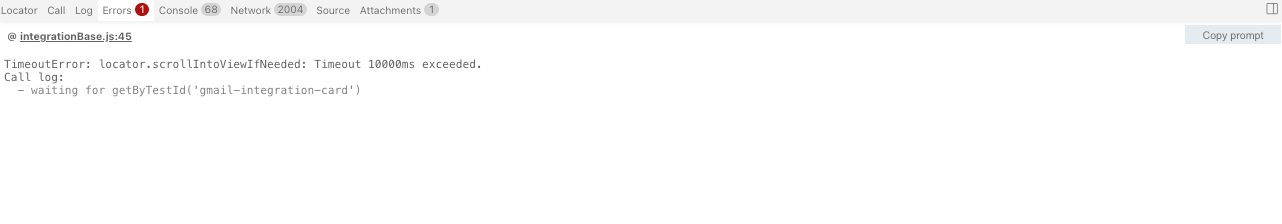
Errors Tab: Failure analysis
When tests fail, the Errors tab is our first stop. It shows:
- Error messages with stack traces.
- Playwright's failure reason.
- Timeout information.
- Expected vs. actual states (for assertions).
The timeline also highlights errors with a red vertical line, making it easy to see when things went wrong. Lists errors and exceptions associated with the action or test step. Includes failure messages, stack traces, and error types to quickly identify what went wrong.
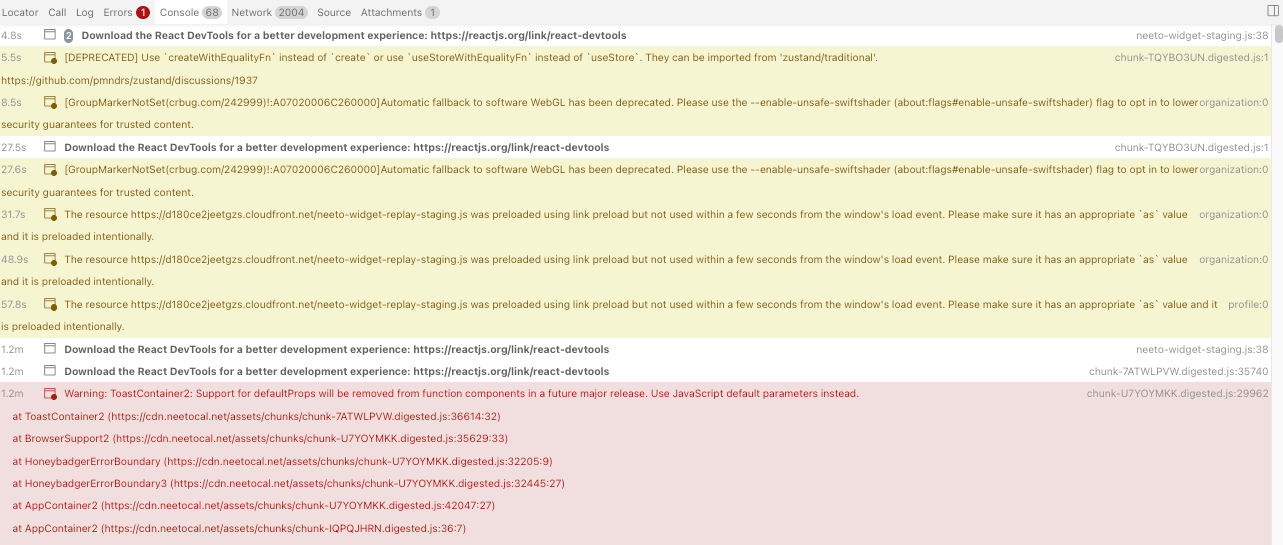
Console Tab: Browser and test logs
The Console tab shows all console output, including:
console.log,console.error,console.warnfrom our application.- Browser warnings and errors.
- Test framework logs.
- Playwright's internal logs.
Visual indicators:
- Different icons distinguish between browser console logs and test logs.
- Error messages are highlighted in red.
- Warnings appear in yellow.
Filtering console logs: Double-click an action in the sidebar to filter console logs to only that action's timeframe. This is crucial when dealing with verbose applications.
Common patterns to look for:
// React errors
Warning: Can't perform a React state update on an unmounted component

// Network errors
Failed to load resource: the server responded with a status of 404

// Application errors
Uncaught TypeError: Cannot read property 'id' of undefined

// CORS issues
Access to fetch at 'https://api.example.com' has been blocked by CORS policy
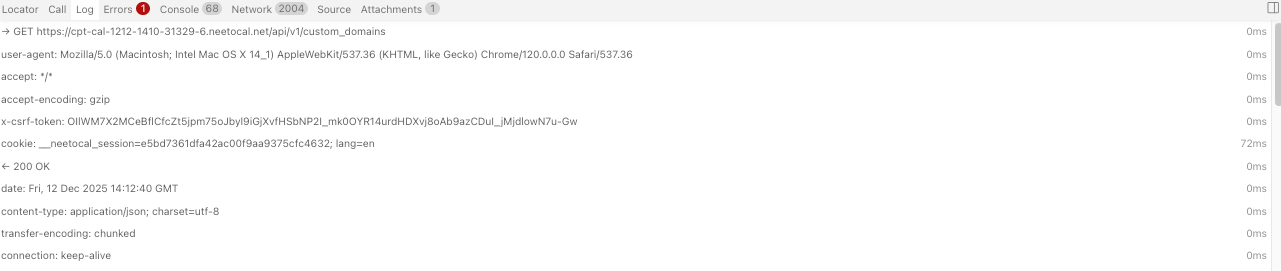
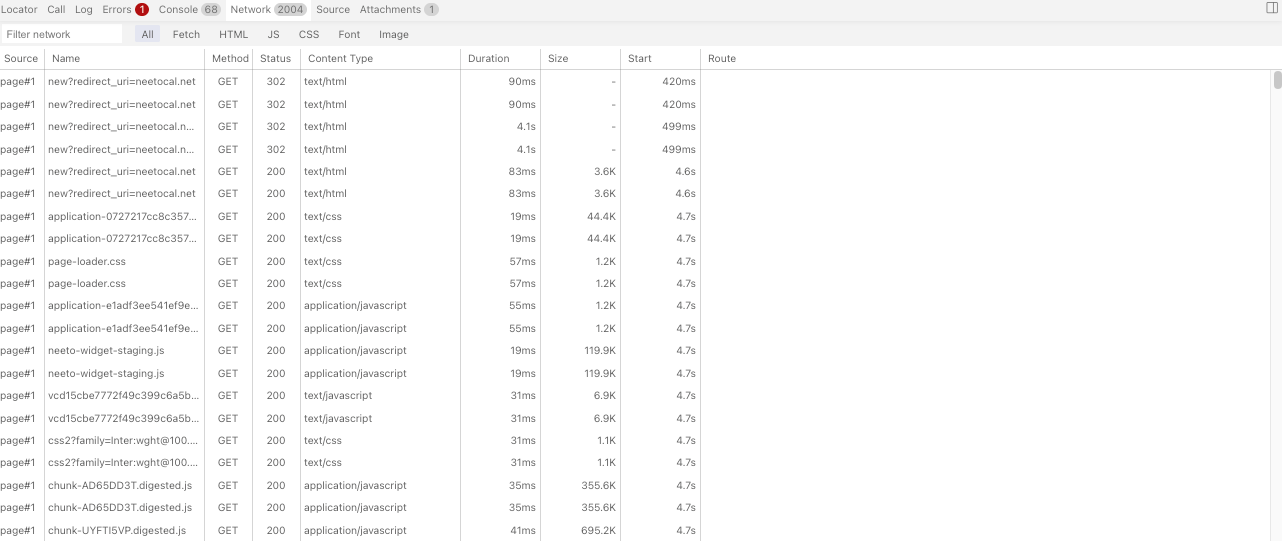
The Network Tab: API and resource investigation
The Network tab is invaluable for debugging issues related to:
- API failures.
- Slow page loads.
- Missing resources.
- Authentication problems.
Key columns:
- Method (GET, POST, PUT, DELETE, etc.)
- URL (full request path)
- Status (200, 404, 500, etc.)
- Content Type (application/json, text/html, etc.)
- Duration (request time)
- Size (response size)
Filtering network requests:
- Use the timeline to select a specific action range.
- The network tab automatically filters to show only requests during that period.
What to investigate:
✓ GET /api/auth/session - 200 - 45ms - application/json
✗ POST /api/bookings/create - 500 - 2.1s - application/json
✓ GET /api/user/profile - 200 - 89ms - application/json
The 500 error on the booking creation is our culprit. Click on it to see:
- Request headers - Is authentication included (CSRF token)?
- Request body - Is the payload correct?
- Response headers - Any CORS issues?
- Response body - What error message did the server return?
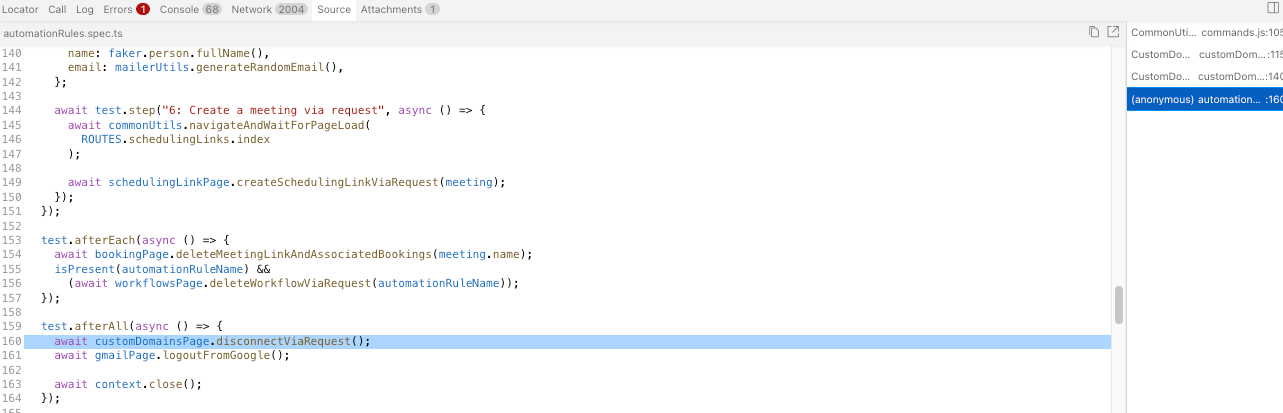
Source Tab: Connecting traces to code
The Source tab displays our test code and highlights the exact line corresponding to the selected action. This is crucial for:
- Understanding what your test was trying to do.
- Verifying locators and test logic.
- Jumping between test code and execution results.
Workflow:
- Click an action in the sidebar.
- Source tab automatically shows the relevant code line.
- Review the locator, expected behavior, and assertions.
- Cross-reference with the DOM snapshot to verify assumptions.
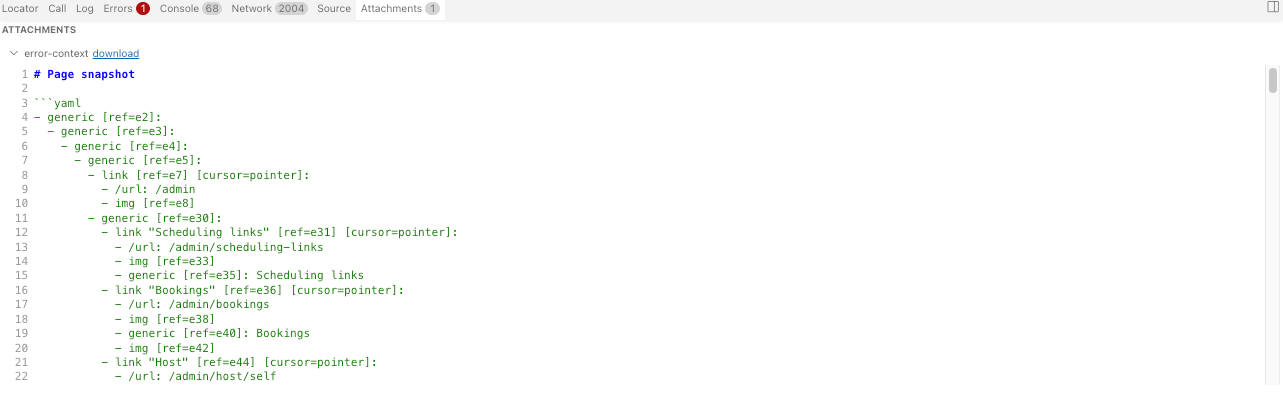
Attachments Tab: Visual regression and screenshots
For tests using visual comparisons or custom attachments, this tab shows:
- Screenshot comparisons (expected, actual, diff)
- Image slider to overlay images and spot differences
- Custom attachments added via
test.attach() - Screenshots & Video recordings (if configured)
Visual regression workflow:
- Navigate to the Attachments tab.
- View the diff image, highlighting differences in red.
- Use the slider to compare expected vs. actual.
- Determine if changes are legitimate or bugs.
Advanced debugging techniques
1. Time-Range filtering for complex tests
For long-running tests with many actions:
- Click a starting point on the timeline.
- Drag to an ending point.
- All tabs (Actions, Network, Console) filter to this range.
- Focus your investigation on the relevant portion.
2. Network request correlation
When debugging API-dependent tests:
- Find the failing action.
- Check the Network tab for API calls during that action.
- Verify request/response timing.
- Ensure data contracts match expectations.
Example investigation:
Test: User creates a booking.
Action: page.click("button[type=submit]").
Network: POST /api/bookings/create - 400 Bad Request.
Response: {"error": "Invalid time slot"}.
Conclusion: Form validation passed, but the API rejected the data.
Next step: Check whether the time slot selection logic has a bug.
3. Console error causation
Browser console errors often precede test failures:
- Review the Console tab chronologically.
- Look for errors before the failing action.
- JavaScript errors may prevent event handlers from working.
- Network errors may leave the UI in an invalid state.
4. Locator strategy validation
When the element isn't found:
- Check the Before snapshot - is the element present?
- Review the Call tab - is the locator correct?
- Use browser DevTools on the snapshot to test alternative locators
5. Race condition detection
Flaky tests often have race conditions:
- Compare traces from passed vs. failed runs.
- Look for timing differences in the Network tab.
- Check if elements appear/disappear between snapshots.
Common debugging scenarios
Scenario 1: "Element Not Found" errors
Trace analysis steps:
- Navigate to the failing click/fill action.
- Examine the Before snapshot - is the element in the DOM?
- Check the Console for JavaScript errors that might prevent rendering.
- Review Network tab - did the page load completely?
- Verify the locator in the Call tab matches the element you expect.
Possible causes:
- Element hasn't rendered yet (needs
waitForSelector). - Wrong locator (typo, dynamic attributes).
- Element is in a different frame/iframe.
- Previous action failed, leaving UI in an unexpected state.
Scenario 2: "Timeout Waiting for Element" errors
Trace analysis steps:
- Check element visibility in the Before snapshot.
- Look at the element's CSS properties (display, opacity, visibility).
- Check for z-index issues or overlapping elements.
- Review the Network tab for slow API responses blocking the UI.
- Check the Console for loading state indicators.
Possible causes:
- CSS hides the element.
- Loading spinner still active.
- API call hasn't completed.
- Modal or overlay blocking interaction.
- Element removed and re-added (Playwright lost reference).
Scenario 3: API failures causing test failures
Trace analysis steps:
- Filter the Network tab to the action's timeframe.
- Find failed API requests (4xx, 5xx status codes).
- Inspect request payload - is test data valid?
- Check the response body for error details.
- Verify authentication headers are present.
Possible causes:
- Test data doesn't match API validation rules.
- Authentication token expired (X-CSRF token).
- Database state inconsistent (previous test didn't clean up).
- API endpoint changed (version mismatch).
Scenario 4: Tests pass locally but fail in CI
Trace analysis steps:
Run the test locally as well and open the traces for both runs (local and CI):
- Compare the Metadata tab - check browser, viewport, timezone differences
- Look for timing differences in action durations
- Check for environment-specific console errors
- Compare Network tab - are API endpoints different?
Possible causes:
- Timezone-dependent test data.
- Slower CI environment (needs longer timeouts).
- Different environment variables.
- Some other tests are affecting the test (very rare case).
Scenario 5: Flaky tests (Intermittent failures)
Trace analysis steps:
- Compare traces from multiple runs (passed and failed).
- Look for timing variations in Network requests.
- Check for race conditions between actions.
- Review auto-wait logs for differences in element stability.
- Look for animations or transitions affecting element states.
Possible causes:
- Race conditions between UI updates and test actions.
- Async operations without proper waits.
- Animations not completing before interaction.
- Network request order is non-deterministic.
- Shared test state between test runs.
Best practices for trace analysis
1. Start with the error
Always begin at the point of failure. The Errors tab and red timeline markers guide you directly there.
2. Trace backwards
After identifying the error, trace back through the actions to determine its root cause, which may be linked to an event that occurred several steps earlier.
3. Compare known-good traces
If you have a passing trace, compare it side-by-side with the failing trace to spot differences quickly.
4. Use timeline filtering liberally
Don't drown in information. Filter the timeline to focus on relevant actions and reduce noise.
5. Correlate across tabs
True debugging power comes from correlating information across tabs:
- Action timing + Network requests + Console logs = complete picture
6. Document your findings
When you identify the root cause, document it:
- Add comments to your test code.
- Update test data or fixtures.
- Fix race conditions with proper waits.
- Report application bugs with trace evidence.
7. Configure appropriate trace collection
In your playwright.config.ts:
export default defineConfig({
  use: {
    // Capture trace only on first retry (recommended for CI)
    trace: "on-first-retry",

    // Or retain traces only for failures
    // trace: 'retain-on-failure',

    // For local debugging, enable traces for all tests
    // trace: 'on',
  },

  // Enable retries to capture traces on failures
  retries: process.env.CI ? 2 : 0,
});
Trace Viewer keyboard shortcuts
Speed up your analysis with these shortcuts:
- Arrow keys - Navigate between actions.
- Esc - Clear selection/filtering.
- Ctrl/Cmd + F - Search within trace.
Accessing traces in NeetoPlaydash
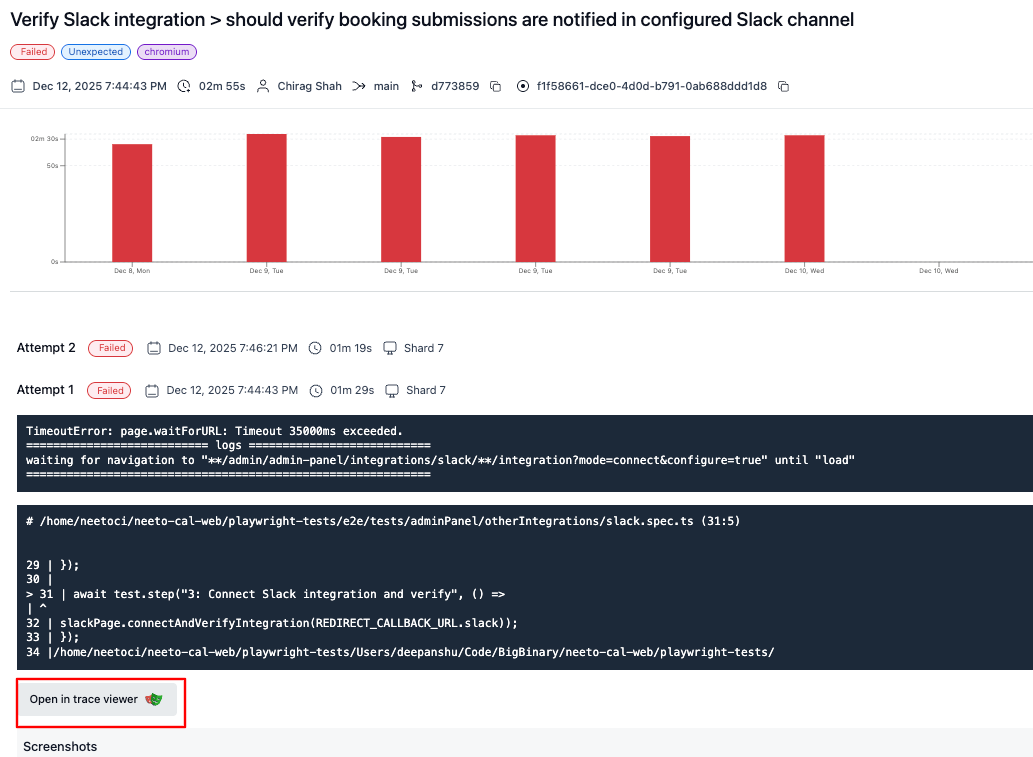
NeetoPlaydash is a test management platform that integrates seamlessly with Playwright's tracing capabilities. When a test runs on CI, Playwright automatically generates trace files. To access them:
- Navigate to NeetoPlaydash - Open your projects dashboard.
- Select a Test Run - Choose the test execution you want to investigate for a particular project.
- Open Test Details Pane - View the details of a specific test.
- Click "Open Trace" - This button launches the Trace Viewer with your test's trace file.
The trace opens in your browser at trace.playwright.dev or locally via the
Playwright CLI, providing a complete, interactive debugging experience without
requiring manual file downloads.
Further resources
Follow @bigbinary on X. Check out our full blog archive.